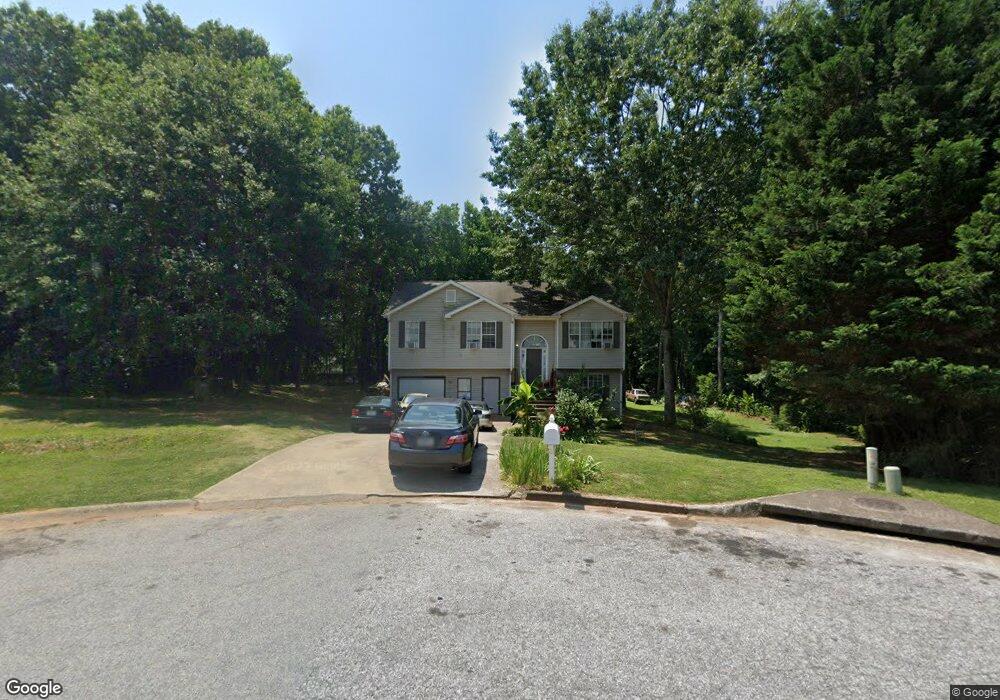
574 Caseys Crossing Unit 3 Winder, GA 30680
Estimated Value: $313,726 - $350,000
Studio
3
Baths
2,162
Sq Ft
$153/Sq Ft
Est. Value
About This Home
This home is located at 574 Caseys Crossing Unit 3, Winder, GA 30680 and is currently estimated at $331,182, approximately $153 per square foot. 574 Caseys Crossing Unit 3 is a home located in Barrow County with nearby schools including Kennedy Elementary School, Westside Middle School, and Apalachee High School.
Ownership History
Date
Name
Owned For
Owner Type
Purchase Details
Closed on
Jun 10, 2023
Sold by
Vang Plia
Bought by
Vang Plia and Yang Sagiya
Current Estimated Value
Purchase Details
Closed on
Mar 16, 1999
Sold by
Macks James W
Bought by
Macks James W and Macks Deborah
Home Financials for this Owner
Home Financials are based on the most recent Mortgage that was taken out on this home.
Original Mortgage
$107,311
Interest Rate
6.74%
Mortgage Type
FHA
Purchase Details
Closed on
Mar 12, 1999
Sold by
Preston Properties Inc
Bought by
Vang Seng and Vang Plia
Home Financials for this Owner
Home Financials are based on the most recent Mortgage that was taken out on this home.
Original Mortgage
$107,311
Interest Rate
6.74%
Mortgage Type
FHA
Purchase Details
Closed on
Oct 22, 1998
Sold by
Developme Dun La Hur
Bought by
Preston Properties I
Purchase Details
Closed on
May 24, 1996
Bought by
Developme Dun La Hur
Create a Home Valuation Report for This Property
The Home Valuation Report is an in-depth analysis detailing your home's value as well as a comparison with similar homes in the area
Home Values in the Area
Average Home Value in this Area
Purchase History
| Date | Buyer | Sale Price | Title Company |
|---|---|---|---|
| Vang Plia | -- | -- | |
| Macks James W | -- | -- | |
| Vang Seng | $107,400 | -- | |
| Preston Properties I | $48,000 | -- | |
| Developme Dun La Hur | -- | -- |
Source: Public Records
Mortgage History
| Date | Status | Borrower | Loan Amount |
|---|---|---|---|
| Previous Owner | Macks James W | $107,311 | |
| Previous Owner | Vang Seng | $107,311 |
Source: Public Records
Tax History
| Year | Tax Paid | Tax Assessment Tax Assessment Total Assessment is a certain percentage of the fair market value that is determined by local assessors to be the total taxable value of land and additions on the property. | Land | Improvement |
|---|---|---|---|---|
| 2025 | $2,132 | $91,593 | $20,800 | $70,793 |
| 2024 | $2,202 | $89,565 | $20,800 | $68,765 |
| 2023 | $1,796 | $89,965 | $20,800 | $69,165 |
| 2022 | $2,351 | $83,318 | $20,800 | $62,518 |
| 2021 | $1,874 | $62,988 | $16,000 | $46,988 |
| 2020 | $1,874 | $62,988 | $16,000 | $46,988 |
| 2019 | $1,905 | $62,988 | $16,000 | $46,988 |
| 2018 | $1,894 | $63,426 | $12,000 | $51,426 |
| 2017 | $1,451 | $49,834 | $12,000 | $37,834 |
| 2016 | $1,305 | $45,147 | $10,400 | $34,747 |
| 2015 | $1,323 | $45,546 | $10,400 | $35,146 |
| 2014 | $1,230 | $42,112 | $6,566 | $35,546 |
| 2013 | -- | $39,517 | $6,566 | $32,951 |
Source: Public Records
Map
Nearby Homes
- 427 Southridge Rd
- 224 Whistleville Ct
- 552 Casey's Crossing
- 544 Casey's Crossing
- 255 Turnberry Ln
- 593 Dunagan Ct
- 613 Bill Rutledge Rd
- 1052 Carl-Bethlehem Rd
- 132 Poplar Way
- 1120 Carl Bethlehem Rd
- 94 Matthews School Rd
- 348 Turtle Creek Dr
- 352 Turtle Creek Dr
- 0 Patrick Mill Rd SW Unit 10654215
- 0 Patrick Mill Rd SW Unit 7689708
- 526 Terrapin Ln
- 503 Terrapin Ln
- 1428 Box Cir
- 1442 Box Cir
- 1452 Box Cir
- 577 Caseys Crossing
- 407 Casey Dr
- 407 Casey Dr Unit 34
- 409 Casey Dr Unit 3
- 575 Caseys Crossing
- 570 Caseys Crossing
- 407 Casey's Dr
- 407 Casey Dr
- 411 Casey Dr Unit 3
- 300 Caseys Ct Unit 3
- 405 Casey Dr Unit 1
- 568 Caseys Crossing
- 403 Casey Dr
- 413 Casey Dr
- 403 Casey's Dr
- 403 Casey Dr
- 569 Caseys Crossing
- 408 Casey's Dr
- 304 Caseys Ct
- 304 Caseys Ct Unit 3
Your Personal Tour Guide
Ask me questions while you tour the home.