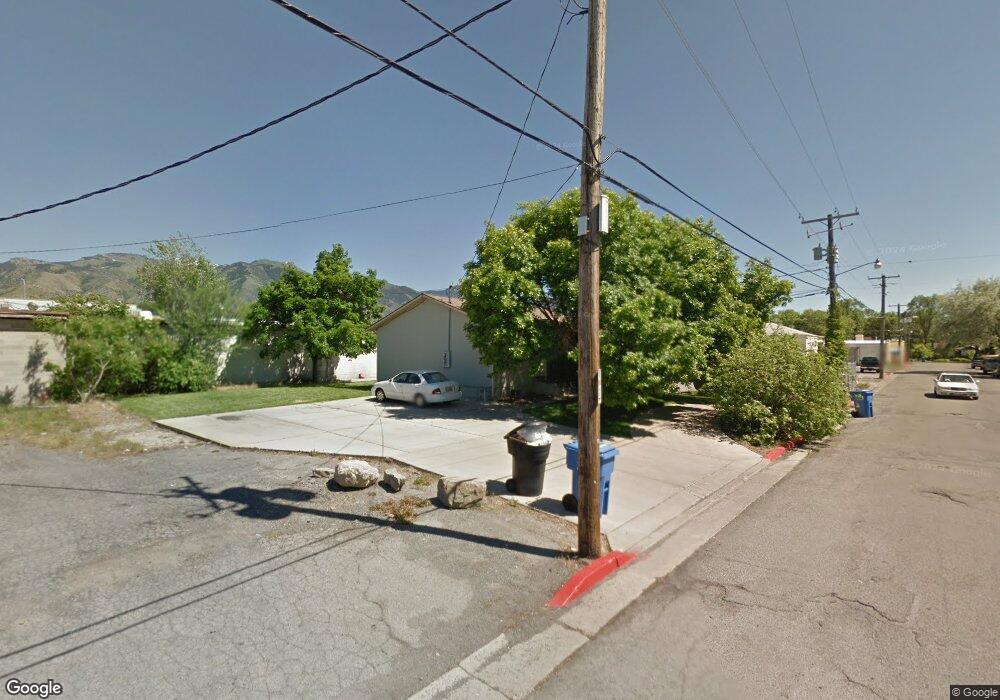
574 Dee Ave Logan, UT 84321
Ellis NeighborhoodEstimated Value: $387,320 - $489,000
4
Beds
2
Baths
1,792
Sq Ft
$237/Sq Ft
Est. Value
About This Home
This home is located at 574 Dee Ave, Logan, UT 84321 and is currently estimated at $423,830, approximately $236 per square foot. 574 Dee Ave is a home located in Cache County with nearby schools including Ellis School, Mount Logan Middle School, and Logan High School.
Ownership History
Date
Name
Owned For
Owner Type
Purchase Details
Closed on
Apr 16, 2021
Sold by
Bb & K Rental Properties Llc
Bought by
Needham Elizabeth
Current Estimated Value
Home Financials for this Owner
Home Financials are based on the most recent Mortgage that was taken out on this home.
Original Mortgage
$284,750
Outstanding Balance
$256,746
Interest Rate
3.05%
Mortgage Type
New Conventional
Estimated Equity
$167,084
Purchase Details
Closed on
Sep 5, 2018
Sold by
Teton Pass Investments L P
Bought by
Bb & K Rental Properties Llc
Create a Home Valuation Report for This Property
The Home Valuation Report is an in-depth analysis detailing your home's value as well as a comparison with similar homes in the area
Home Values in the Area
Average Home Value in this Area
Purchase History
| Date | Buyer | Sale Price | Title Company |
|---|---|---|---|
| Needham Elizabeth | -- | Hickman Land Title Logan | |
| Bb & K Rental Properties Llc | -- | Hickman Land Title Co |
Source: Public Records
Mortgage History
| Date | Status | Borrower | Loan Amount |
|---|---|---|---|
| Open | Needham Elizabeth | $284,750 |
Source: Public Records
Tax History
| Year | Tax Paid | Tax Assessment Tax Assessment Total Assessment is a certain percentage of the fair market value that is determined by local assessors to be the total taxable value of land and additions on the property. | Land | Improvement |
|---|---|---|---|---|
| 2025 | $153 | $358,910 | $137,700 | $221,210 |
| 2024 | $1,576 | $358,910 | $137,700 | $221,210 |
| 2023 | $1,641 | $356,210 | $135,000 | $221,210 |
| 2022 | $1,757 | $356,210 | $135,000 | $221,210 |
| 2021 | $1,806 | $311,100 | $110,000 | $201,100 |
| 2020 | $1,396 | $216,400 | $75,000 | $141,400 |
| 2019 | $1,459 | $216,400 | $75,000 | $141,400 |
| 2018 | $1,276 | $172,810 | $55,000 | $117,810 |
| 2017 | $1,245 | $89,155 | $0 | $0 |
| 2016 | $1,291 | $80,905 | $0 | $0 |
| 2015 | $1,173 | $80,905 | $0 | $0 |
| 2014 | $1,060 | $80,905 | $0 | $0 |
| 2013 | -- | $76,230 | $0 | $0 |
Source: Public Records
Map
Nearby Homes
Your Personal Tour Guide
Ask me questions while you tour the home.