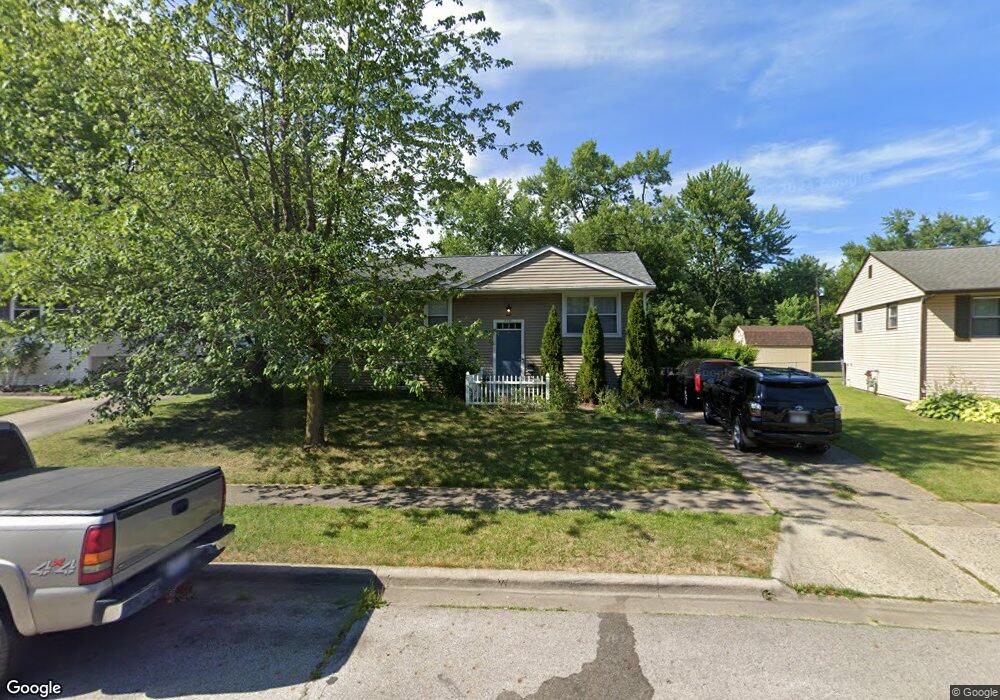
574 Fenchurch Way Columbus, OH 43230
Estimated Value: $276,000 - $308,000
3
Beds
2
Baths
1,655
Sq Ft
$173/Sq Ft
Est. Value
About This Home
This home is located at 574 Fenchurch Way, Columbus, OH 43230 and is currently estimated at $286,455, approximately $173 per square foot. 574 Fenchurch Way is a home located in Franklin County with nearby schools including Royal Manor Elementary School, Gahanna West Middle School, and Lincoln High School.
Ownership History
Date
Name
Owned For
Owner Type
Purchase Details
Closed on
Apr 28, 2016
Sold by
Hale Barry M
Bought by
Tri Card Investments Llc
Current Estimated Value
Home Financials for this Owner
Home Financials are based on the most recent Mortgage that was taken out on this home.
Original Mortgage
$98,000
Outstanding Balance
$7,729
Interest Rate
3.73%
Mortgage Type
Future Advance Clause Open End Mortgage
Estimated Equity
$278,726
Purchase Details
Closed on
Nov 2, 2006
Sold by
Soskin Alex
Bought by
Hale Barry M
Home Financials for this Owner
Home Financials are based on the most recent Mortgage that was taken out on this home.
Original Mortgage
$137,500
Interest Rate
6.45%
Mortgage Type
Purchase Money Mortgage
Purchase Details
Closed on
Jun 28, 2006
Sold by
Dlj Mortgage Capital Inc
Bought by
Soskin Alex
Purchase Details
Closed on
Jun 23, 2006
Sold by
Gamble Larry D and Bank United
Bought by
Dlj Mortgage Capital Inc
Purchase Details
Closed on
Sep 23, 1981
Bought by
Gamble Larry D
Create a Home Valuation Report for This Property
The Home Valuation Report is an in-depth analysis detailing your home's value as well as a comparison with similar homes in the area
Home Values in the Area
Average Home Value in this Area
Purchase History
| Date | Buyer | Sale Price | Title Company |
|---|---|---|---|
| Tri Card Investments Llc | $123,000 | Stewart Title Box | |
| Hale Barry M | $137,500 | Valmer | |
| Soskin Alex | $88,000 | Resource T | |
| Dlj Mortgage Capital Inc | $90,000 | Resource T | |
| Gamble Larry D | $40,900 | -- |
Source: Public Records
Mortgage History
| Date | Status | Borrower | Loan Amount |
|---|---|---|---|
| Open | Tri Card Investments Llc | $98,000 | |
| Previous Owner | Hale Barry M | $137,500 |
Source: Public Records
Tax History Compared to Growth
Tax History
| Year | Tax Paid | Tax Assessment Tax Assessment Total Assessment is a certain percentage of the fair market value that is determined by local assessors to be the total taxable value of land and additions on the property. | Land | Improvement |
|---|---|---|---|---|
| 2024 | $4,674 | $77,770 | $24,220 | $53,550 |
| 2023 | $4,616 | $77,770 | $24,220 | $53,550 |
| 2022 | $3,772 | $49,490 | $13,370 | $36,120 |
| 2021 | $3,650 | $49,490 | $13,370 | $36,120 |
| 2020 | $3,621 | $49,490 | $13,370 | $36,120 |
| 2019 | $3,005 | $40,850 | $11,130 | $29,720 |
| 2018 | $1,492 | $40,850 | $11,130 | $29,720 |
| 2017 | $2,765 | $40,850 | $11,130 | $29,720 |
| 2016 | $3,208 | $43,160 | $9,840 | $33,320 |
| 2015 | $1,605 | $43,160 | $9,840 | $33,320 |
| 2014 | $3,186 | $43,160 | $9,840 | $33,320 |
| 2013 | $1,539 | $43,155 | $9,835 | $33,320 |
Source: Public Records
Map
Nearby Homes
- 221 Lincolnshire Rd
- 600 Agler Rd
- 491 Daventry Ln
- 348 Imperial Dr
- 388 Elkwood Place
- 3888 Agler Rd
- 4125 Emerius Dr
- 3784 Armuth Ave
- 2694 Kantian Dr
- 0 E Minnesota Ave Unit 224018641
- 3832 Emmons Ave
- 2423 Stelzer Rd
- 0 E Emmons Ave
- 2275 Stelzer Rd
- 2457 Ashpoint St
- 3601 Agler Rd
- 300 Dunbarton Rd
- 536 Springwood Lake Dr
- 3877 Hines Rd
- 407 Denison Ave
- 578 Fenchurch Way
- 568 Fenchurch Way
- 567 Knights Ave
- 573 Knights Ave
- 584 Fenchurch Way
- 562 Fenchurch Way
- 561 Knights Ave
- 579 Knights Ave
- 571 Fenchurch Way
- 555 Knights Ave
- 579 Fenchurch Way
- 563 Fenchurch Way
- 590 Fenchurch Way
- 585 Knights Ave
- 558 Fenchurch Way
- 549 Knights Ave
- 585 Fenchurch Way
- 553 Fenchurch Way
- 596 Fenchurch Way
- 572 Knights Ave