Estimated Value: $171,000 - $191,000
3
Beds
1
Bath
1,077
Sq Ft
$166/Sq Ft
Est. Value
About This Home
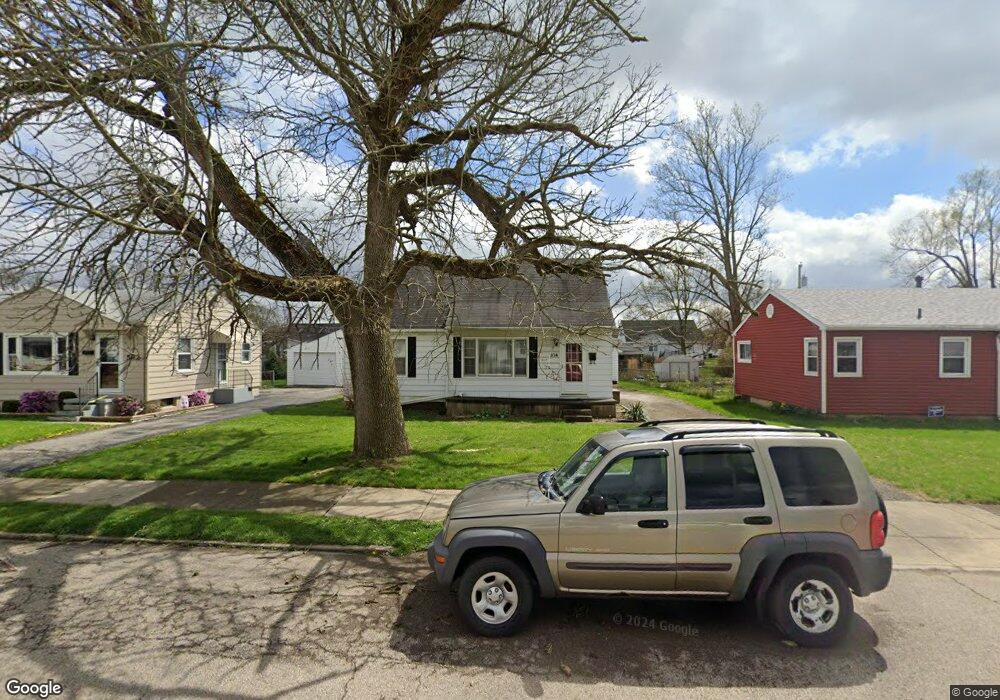
This home is located at 574 Fernwood Dr, Troy, OH 45373 and is currently estimated at $179,272, approximately $166 per square foot. 574 Fernwood Dr is a home located in Miami County with nearby schools including Troy Junior High School, Van Cleve Elementary School, and Troy High School.
Ownership History
Date
Name
Owned For
Owner Type
Purchase Details
Closed on
May 10, 2001
Sold by
Lambert Jonathan C
Bought by
Lambert Angela and Marshall Angie
Current Estimated Value
Purchase Details
Closed on
Feb 29, 1996
Sold by
Borton Richard S
Bought by
Marshall Angie V and Lambert Jonathan C
Home Financials for this Owner
Home Financials are based on the most recent Mortgage that was taken out on this home.
Original Mortgage
$73,500
Interest Rate
7.07%
Mortgage Type
New Conventional
Purchase Details
Closed on
Apr 1, 1988
Bought by
Borton Richard S
Create a Home Valuation Report for This Property
The Home Valuation Report is an in-depth analysis detailing your home's value as well as a comparison with similar homes in the area
Home Values in the Area
Average Home Value in this Area
Purchase History
| Date | Buyer | Sale Price | Title Company |
|---|---|---|---|
| Lambert Angela | -- | -- | |
| Marshall Angie V | $77,400 | -- | |
| Borton Richard S | $45,900 | -- |
Source: Public Records
Mortgage History
| Date | Status | Borrower | Loan Amount |
|---|---|---|---|
| Previous Owner | Marshall Angie V | $73,500 |
Source: Public Records
Tax History Compared to Growth
Tax History
| Year | Tax Paid | Tax Assessment Tax Assessment Total Assessment is a certain percentage of the fair market value that is determined by local assessors to be the total taxable value of land and additions on the property. | Land | Improvement |
|---|---|---|---|---|
| 2024 | $1,392 | $36,930 | $10,190 | $26,740 |
| 2023 | $1,392 | $36,930 | $10,190 | $26,740 |
| 2022 | $1,160 | $36,930 | $10,190 | $26,740 |
| 2021 | $939 | $28,420 | $7,840 | $20,580 |
| 2020 | $941 | $28,420 | $7,840 | $20,580 |
| 2019 | $949 | $28,420 | $7,840 | $20,580 |
| 2018 | $909 | $26,190 | $7,670 | $18,520 |
| 2017 | $918 | $26,190 | $7,670 | $18,520 |
| 2016 | $904 | $26,190 | $7,670 | $18,520 |
| 2015 | $874 | $24,260 | $7,110 | $17,150 |
| 2014 | $874 | $24,260 | $7,110 | $17,150 |
| 2013 | $880 | $24,260 | $7,110 | $17,150 |
Source: Public Records
Map
Nearby Homes
- 605 Ohio Ave
- 731 Michigan Ave
- 1075 Crestview Dr
- 708 N Market St
- 429 Forrest Ln
- 190 Robin Hood Ln
- 1002 Stonyridge Ave
- 1329 Lee Rd
- 221 Finsbury Ln
- 316 E Franklin St
- 755 W Bentley Cir
- 1160 Waterloo St
- 1164 Waterloo St
- 118 S Walnut St
- 1102 E Franklin St
- 1188 E Bentley Cir
- 1137 Auburn St
- 838 W Bentley Cir
- 813 W Bentley Cir
- 582 Fernwood Dr
- 566 Fernwood Dr
- 590 Fernwood Dr
- 560 Fernwood Dr
- 573 Linwood Dr
- 565 Linwood Dr
- 581 Linwood Dr
- 552 Fernwood Dr
- 598 Fernwood Dr
- 559 Linwood Dr
- 589 Linwood Dr
- 573 Fernwood Dr
- 581 Fernwood Dr
- 565 Fernwood Dr
- 551 Linwood Dr
- 597 Linwood Dr
- 589 Fernwood Dr
- 546 Fernwood Dr
- 597 Fernwood Dr
- 551 Fernwood Dr