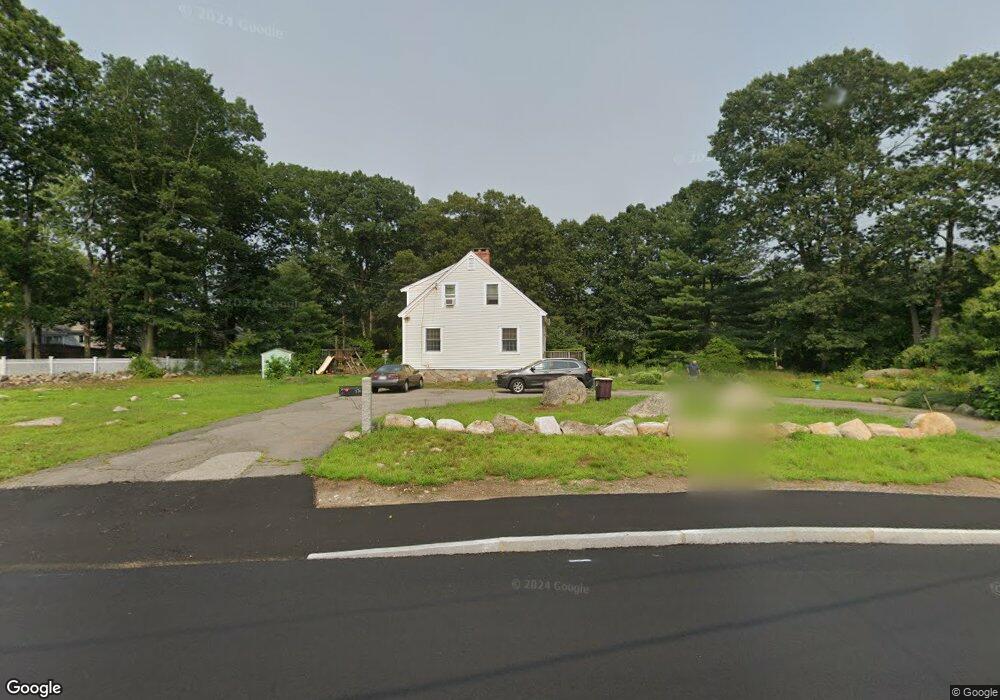
574 Summer St Weymouth, MA 02188
South Weymouth NeighborhoodEstimated Value: $571,645 - $656,000
Studio
2
Baths
1,365
Sq Ft
$453/Sq Ft
Est. Value
About This Home
This home is located at 574 Summer St, Weymouth, MA 02188 and is currently estimated at $618,161, approximately $452 per square foot. 574 Summer St is a home located in Norfolk County with nearby schools including Frederick C Murphy, Abigail Adams Middle School, and Weymouth Middle School Chapman.
Ownership History
Date
Name
Owned For
Owner Type
Purchase Details
Closed on
Oct 12, 2023
Sold by
Slyman Michael J and Slyman Susan M
Bought by
Slyman Int and Slyman S
Current Estimated Value
Purchase Details
Closed on
Dec 10, 1992
Sold by
Slyman Mary L
Bought by
Slyman Michael J and Slyman Susan M
Home Financials for this Owner
Home Financials are based on the most recent Mortgage that was taken out on this home.
Original Mortgage
$90,000
Interest Rate
8.16%
Mortgage Type
Purchase Money Mortgage
Create a Home Valuation Report for This Property
The Home Valuation Report is an in-depth analysis detailing your home's value as well as a comparison with similar homes in the area
Home Values in the Area
Average Home Value in this Area
Purchase History
| Date | Buyer | Sale Price | Title Company |
|---|---|---|---|
| Slyman Int | -- | None Available | |
| Slyman Michael J | $113,000 | -- | |
| Slyman Michael J | $113,000 | -- |
Source: Public Records
Mortgage History
| Date | Status | Borrower | Loan Amount |
|---|---|---|---|
| Previous Owner | Slyman Michael J | $90,000 |
Source: Public Records
Tax History
| Year | Tax Paid | Tax Assessment Tax Assessment Total Assessment is a certain percentage of the fair market value that is determined by local assessors to be the total taxable value of land and additions on the property. | Land | Improvement |
|---|---|---|---|---|
| 2025 | $5,001 | $495,100 | $232,700 | $262,400 |
| 2024 | $4,843 | $471,600 | $221,600 | $250,000 |
| 2023 | $4,565 | $436,800 | $205,200 | $231,600 |
| 2022 | $4,469 | $390,000 | $190,000 | $200,000 |
| 2021 | $4,213 | $358,900 | $190,000 | $168,900 |
| 2020 | $4,023 | $337,500 | $190,000 | $147,500 |
| 2019 | $3,926 | $323,900 | $182,700 | $141,200 |
| 2018 | $3,813 | $305,000 | $174,000 | $131,000 |
| 2017 | $3,723 | $290,600 | $165,800 | $124,800 |
| 2016 | $3,579 | $279,600 | $159,500 | $120,100 |
| 2015 | $3,469 | $268,900 | $159,500 | $109,400 |
| 2014 | $3,269 | $245,800 | $148,400 | $97,400 |
Source: Public Records
Map
Nearby Homes
- 501 Commerce Dr Unit 2310
- 300 West St
- 73 Ryder Rd
- 17 Berean Way
- 432 Grove St
- 972 Liberty St
- 82 Lester Ln
- 16 Jay Rd
- 8 Tara Dr Unit 4
- 8 Tara Dr Unit 5
- 2 Mitchell Ln Unit B
- 54 Old Quarry Dr
- 68 Massapoag St Unit 7
- 107 Summer St
- 257 Allerton Commons Ln
- 747 Middle St
- 27 Park Ave
- 33 Congress St
- 31 Doris Rd
- 426 John Mahar Hwy Unit 311
Your Personal Tour Guide
Ask me questions while you tour the home.