Estimated Value: $419,000 - $450,000
3
Beds
2
Baths
1,780
Sq Ft
$243/Sq Ft
Est. Value
About This Home
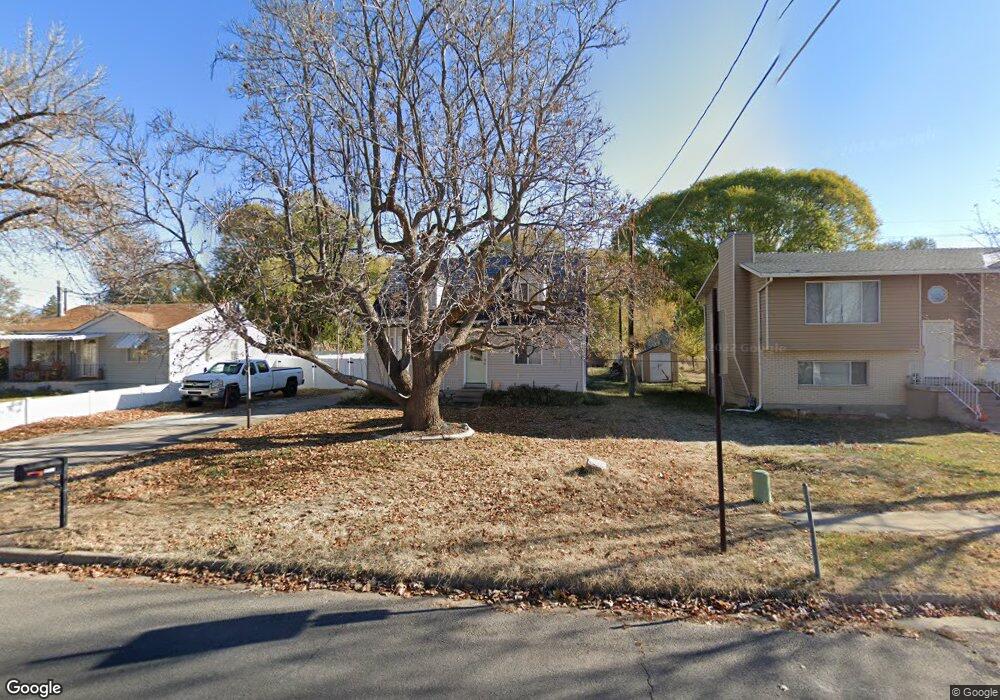
This home is located at 5740 S 2775 W, Roy, UT 84067 and is currently estimated at $432,166, approximately $242 per square foot. 5740 S 2775 W is a home located in Weber County with nearby schools including Roy Elementary School, Roy Junior High School, and Roy High School.
Ownership History
Date
Name
Owned For
Owner Type
Purchase Details
Closed on
Mar 29, 2016
Bought by
Warner David W
Current Estimated Value
Home Financials for this Owner
Home Financials are based on the most recent Mortgage that was taken out on this home.
Original Mortgage
$162,181
Outstanding Balance
$128,970
Interest Rate
3.71%
Estimated Equity
$303,196
Purchase Details
Closed on
Jul 17, 2008
Sold by
Ramage Stephen P and Ramage Sarah L
Bought by
Drake Spencer L and Drake Elissa S
Home Financials for this Owner
Home Financials are based on the most recent Mortgage that was taken out on this home.
Original Mortgage
$8,855
Interest Rate
6.07%
Mortgage Type
Stand Alone Second
Purchase Details
Closed on
Jul 1, 1999
Sold by
Venable Bruce E and Venable Susie
Bought by
Ramage Stephen P and Ramage Sarah L
Home Financials for this Owner
Home Financials are based on the most recent Mortgage that was taken out on this home.
Original Mortgage
$101,842
Interest Rate
7.2%
Mortgage Type
FHA
Create a Home Valuation Report for This Property
The Home Valuation Report is an in-depth analysis detailing your home's value as well as a comparison with similar homes in the area
Home Values in the Area
Average Home Value in this Area
Purchase History
| Date | Buyer | Sale Price | Title Company |
|---|---|---|---|
| Warner David W | -- | -- | |
| Drake Spencer L | -- | First American Builder Svc | |
| Ramage Stephen P | -- | Bonneville Title Company |
Source: Public Records
Mortgage History
| Date | Status | Borrower | Loan Amount |
|---|---|---|---|
| Open | Warner David W | $162,181 | |
| Closed | Warner David W | -- | |
| Previous Owner | Drake Spencer L | $8,855 | |
| Previous Owner | Drake Spencer L | $147,584 | |
| Previous Owner | Ramage Stephen P | $101,842 |
Source: Public Records
Tax History
| Year | Tax Paid | Tax Assessment Tax Assessment Total Assessment is a certain percentage of the fair market value that is determined by local assessors to be the total taxable value of land and additions on the property. | Land | Improvement |
|---|---|---|---|---|
| 2025 | $2,472 | $389,337 | $128,384 | $260,953 |
| 2024 | $2,414 | $210,648 | $70,626 | $140,022 |
| 2023 | $2,357 | $206,249 | $67,930 | $138,319 |
| 2022 | $2,241 | $200,750 | $57,766 | $142,984 |
| 2021 | $1,931 | $285,000 | $68,670 | $216,330 |
| 2020 | $1,716 | $231,000 | $68,670 | $162,330 |
| 2019 | $1,610 | $203,000 | $42,946 | $160,054 |
| 2018 | $1,455 | $171,000 | $39,932 | $131,068 |
| 2017 | $1,474 | $163,520 | $38,562 | $124,958 |
| 2016 | $1,337 | $78,944 | $19,890 | $59,054 |
| 2015 | $1,170 | $69,673 | $19,890 | $49,783 |
| 2014 | $1,160 | $68,282 | $19,890 | $48,392 |
Source: Public Records
Map
Nearby Homes
Your Personal Tour Guide
Ask me questions while you tour the home.