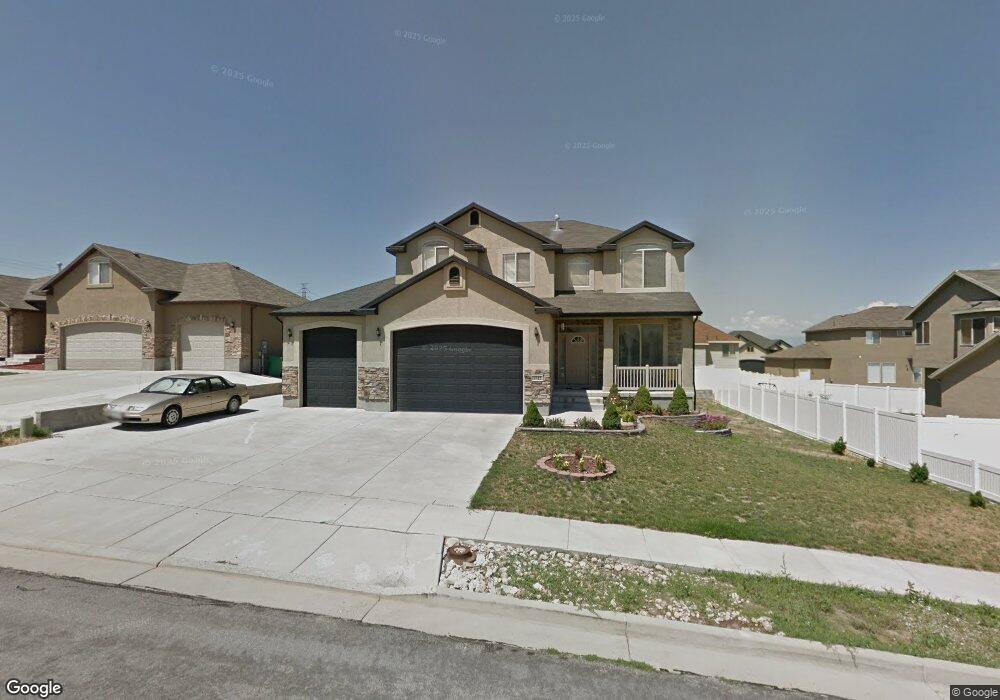
5742 Moon Crest Ct West Jordan, UT 84081
Oquirrh NeighborhoodEstimated Value: $608,000 - $629,000
4
Beds
3
Baths
3,113
Sq Ft
$199/Sq Ft
Est. Value
About This Home
This home is located at 5742 Moon Crest Ct, West Jordan, UT 84081 and is currently estimated at $619,026, approximately $198 per square foot. 5742 Moon Crest Ct is a home located in Salt Lake County with nearby schools including Falcon Ridge School, Sunset Ridge Middle School, and Copper Hills High School.
Ownership History
Date
Name
Owned For
Owner Type
Purchase Details
Closed on
Jul 26, 2013
Sold by
Salerno Michael and Salerno Lolita
Bought by
Ong David D and Pan Yvonne
Current Estimated Value
Home Financials for this Owner
Home Financials are based on the most recent Mortgage that was taken out on this home.
Original Mortgage
$150,000
Interest Rate
3.98%
Mortgage Type
New Conventional
Purchase Details
Closed on
Sep 13, 2007
Sold by
Salerno Michael
Bought by
Salerno Michael and Salerno Lolita
Home Financials for this Owner
Home Financials are based on the most recent Mortgage that was taken out on this home.
Original Mortgage
$288,000
Interest Rate
6%
Mortgage Type
Purchase Money Mortgage
Create a Home Valuation Report for This Property
The Home Valuation Report is an in-depth analysis detailing your home's value as well as a comparison with similar homes in the area
Home Values in the Area
Average Home Value in this Area
Purchase History
| Date | Buyer | Sale Price | Title Company |
|---|---|---|---|
| Ong David D | -- | American Preferred Title Slc | |
| Salerno Michael | -- | Merrill Title | |
| Salerno Michael | -- | Merrill Title |
Source: Public Records
Mortgage History
| Date | Status | Borrower | Loan Amount |
|---|---|---|---|
| Closed | Ong David D | $150,000 | |
| Previous Owner | Salerno Michael | $288,000 | |
| Previous Owner | Salerno Michael | $54,000 |
Source: Public Records
Tax History Compared to Growth
Tax History
| Year | Tax Paid | Tax Assessment Tax Assessment Total Assessment is a certain percentage of the fair market value that is determined by local assessors to be the total taxable value of land and additions on the property. | Land | Improvement |
|---|---|---|---|---|
| 2025 | $3,413 | $605,700 | $150,000 | $455,700 |
| 2024 | $3,413 | $576,900 | $144,200 | $432,700 |
| 2023 | $3,452 | $548,200 | $138,700 | $409,500 |
| 2022 | $3,645 | $575,500 | $136,000 | $439,500 |
| 2021 | $3,210 | $470,500 | $104,600 | $365,900 |
| 2020 | $2,912 | $398,600 | $97,000 | $301,600 |
| 2019 | $2,885 | $386,200 | $91,500 | $294,700 |
| 2018 | $2,712 | $358,300 | $91,500 | $266,800 |
| 2017 | $2,602 | $338,800 | $91,500 | $247,300 |
| 2016 | $2,691 | $329,600 | $84,700 | $244,900 |
| 2015 | $2,345 | $277,000 | $91,100 | $185,900 |
| 2014 | $2,285 | $265,200 | $88,300 | $176,900 |
Source: Public Records
Map
Nearby Homes
- 5732 W Moon Crest Ct
- 6739 S Sol Rise Dr
- 6838 Discovery Ct
- 5581 Bluevail Ct
- 5508 W 6635 S
- 5961 W Chiswick Ct
- 6680 S Leichen Ct
- 6778 Turnstone Ct
- 6922 Mullien Dr
- 5882 W 7000 S
- 6853 Mullien Dr
- 6123 August Ln
- 7259 W Cibola Rd
- 6489 S Daffodil Way
- 6116 W Graceland Way
- 6705 S High Bluff Dr
- 6806 Duchess St
- 7134 S Rialto Way
- 6439 S Clernates Dr
- 6892 S Willowpond Way
- 5742 W Moon Crest Ct
- 5732 Moon Crest Ct
- 5754 Moon Crest Ct
- 5754 W Moon Crest Ct
- 5737 W 6635 S
- 5749 W 6635 S
- 5723 W 6635 S
- 5741 Moon Crest Ct
- 5727 Moon Crest Ct
- 5727 W Moon Crest Ct
- 5722 Moon Crest Ct
- 5722 W Moon Crest Ct
- 5764 W Moon Crest Ct
- 5763 W 6635 S
- 5753 Moon Crest Ct
- 5764 W Moon Crest Ct
- 5711 W 6635 S
- 5766 Moon Crest Ct
- 5766 W Moon Crest Ct
- 5719 Moon Crest Ct