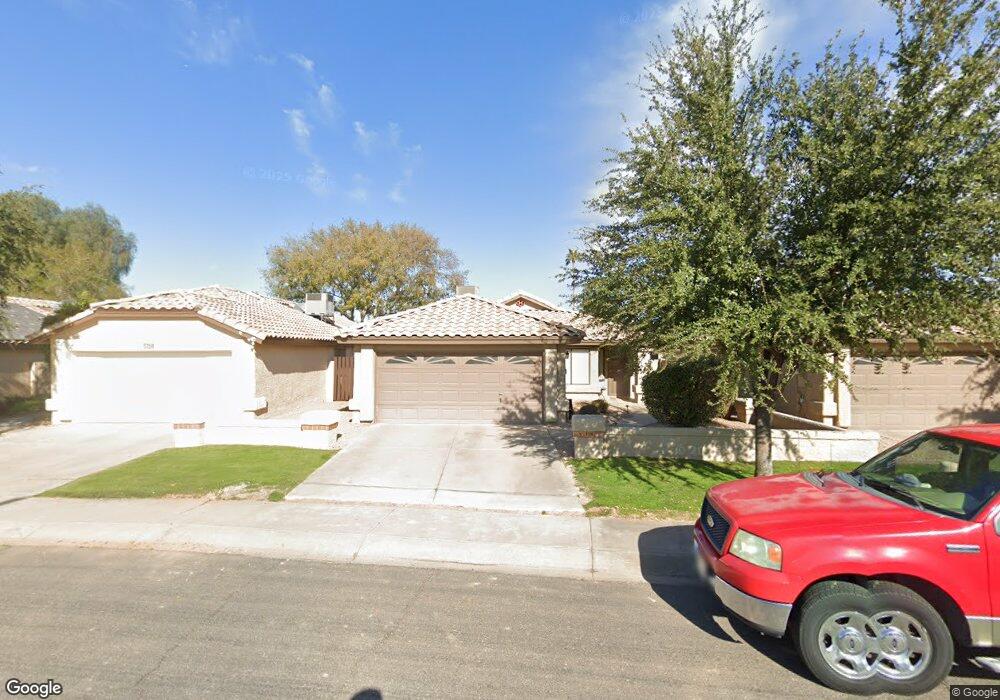
5742 W Mercury Way Chandler, AZ 85226
West Chandler NeighborhoodEstimated Value: $388,335 - $448,000
3
Beds
2
Baths
1,295
Sq Ft
$326/Sq Ft
Est. Value
About This Home
This home is located at 5742 W Mercury Way, Chandler, AZ 85226 and is currently estimated at $422,084, approximately $325 per square foot. 5742 W Mercury Way is a home located in Maricopa County with nearby schools including Kyrene de la Paloma School, Kyrene del Pueblo Middle School, and Mountain Pointe High School.
Ownership History
Date
Name
Owned For
Owner Type
Purchase Details
Closed on
Jun 28, 2012
Sold by
Durkin June
Bought by
West Mercury Llc
Current Estimated Value
Purchase Details
Closed on
May 6, 2003
Sold by
Durkin June H
Bought by
Durkin June and The Durkin Trust
Home Financials for this Owner
Home Financials are based on the most recent Mortgage that was taken out on this home.
Original Mortgage
$100,000
Interest Rate
5.53%
Mortgage Type
Purchase Money Mortgage
Purchase Details
Closed on
Nov 17, 2000
Sold by
Durkin June and Mazza June
Bought by
Durkin June and The Durkin Trust
Purchase Details
Closed on
Jun 29, 2000
Sold by
Wilson Joseph William
Bought by
Mazza June
Home Financials for this Owner
Home Financials are based on the most recent Mortgage that was taken out on this home.
Original Mortgage
$99,900
Interest Rate
8.63%
Mortgage Type
New Conventional
Create a Home Valuation Report for This Property
The Home Valuation Report is an in-depth analysis detailing your home's value as well as a comparison with similar homes in the area
Home Values in the Area
Average Home Value in this Area
Purchase History
| Date | Buyer | Sale Price | Title Company |
|---|---|---|---|
| West Mercury Llc | -- | None Available | |
| Durkin June | -- | Capital Title Agency Inc | |
| Durkin June H | -- | Capital Title Agency Inc | |
| Durkin June | -- | -- | |
| Mazza June | $124,000 | Capital Title Agency |
Source: Public Records
Mortgage History
| Date | Status | Borrower | Loan Amount |
|---|---|---|---|
| Previous Owner | Durkin June H | $100,000 | |
| Previous Owner | Mazza June | $99,900 |
Source: Public Records
Tax History Compared to Growth
Tax History
| Year | Tax Paid | Tax Assessment Tax Assessment Total Assessment is a certain percentage of the fair market value that is determined by local assessors to be the total taxable value of land and additions on the property. | Land | Improvement |
|---|---|---|---|---|
| 2025 | $1,787 | $18,758 | -- | -- |
| 2024 | $1,711 | $17,864 | -- | -- |
| 2023 | $1,711 | $31,030 | $6,200 | $24,830 |
| 2022 | $1,638 | $23,130 | $4,620 | $18,510 |
| 2021 | $1,692 | $21,620 | $4,320 | $17,300 |
| 2020 | $1,657 | $19,850 | $3,970 | $15,880 |
| 2019 | $1,611 | $18,460 | $3,690 | $14,770 |
| 2018 | $1,564 | $17,180 | $3,430 | $13,750 |
| 2017 | $1,496 | $16,030 | $3,200 | $12,830 |
| 2016 | $1,517 | $14,820 | $2,960 | $11,860 |
| 2015 | $1,398 | $14,060 | $2,810 | $11,250 |
Source: Public Records
Map
Nearby Homes
- 5882 W Mercury Way
- 5455 W Buffalo St
- 300 N Gila Springs Blvd Unit 181
- 255 S Kyrene Rd Unit 231
- 255 S Kyrene Rd Unit 111
- 500 N Gila Springs Blvd Unit 230
- 500 N Gila Springs Blvd Unit 113
- 5143 W Mercury Way
- 5151 W Glenview Place
- 5137 W Jupiter Way
- 5665 W Galveston St Unit 76
- 5580 W Kesler St
- 547 N Maple St
- 5751 W Del Rio St
- 840 S Pineview Dr
- 5361 W Saragosa St
- 5959 W Del Rio St
- 5330 W Kesler Ln
- 500 N Roosevelt Ave Unit 2
- 500 N Roosevelt Ave Unit 87
- 5734 W Mercury Way
- 5750 W Mercury Way
- 5758 W Mercury Way
- 5741 W Commonwealth Place
- 5733 W Commonwealth Place
- 5749 W Commonwealth Place
- 5725 W Commonwealth Place
- 5766 W Mercury Way
- 5718 W Mercury Way
- 5757 W Commonwealth Place
- 5717 W Commonwealth Place
- 5749 W Mercury Way
- 5741 W Mercury Way
- 54 S Crestview St
- 5757 W Mercury Way
- 5774 W Mercury Way Unit WOW!
- 5774 W Mercury Way
- 5765 W Commonwealth Place
- 5710 W Mercury Way
- 5709 W Commonwealth Place