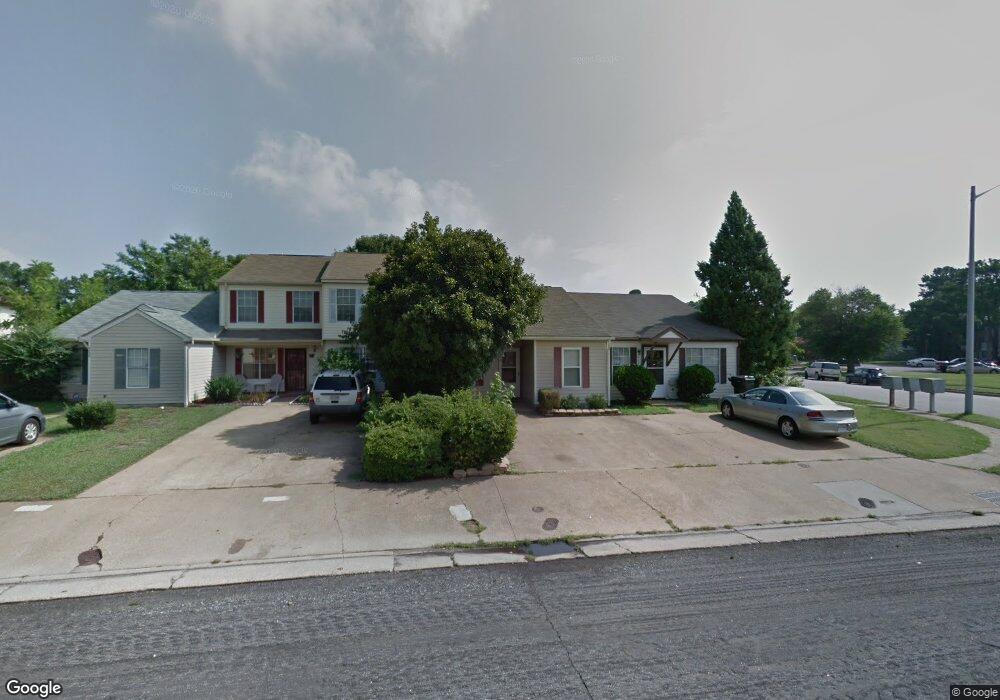
5742 Weblin Dr Virginia Beach, VA 23462
Estimated Value: $226,000 - $226,111
3
Beds
2
Baths
1,064
Sq Ft
$212/Sq Ft
Est. Value
About This Home
This home is located at 5742 Weblin Dr, Virginia Beach, VA 23462 and is currently estimated at $226,028, approximately $212 per square foot. 5742 Weblin Dr is a home located in Virginia Beach City with nearby schools including Bettie F. Williams Elementary, Newtown Elementary School, and Diamond Springs Elementary School.
Ownership History
Date
Name
Owned For
Owner Type
Purchase Details
Closed on
Oct 22, 2019
Sold by
Morris Merrick B
Bought by
Machado Antonio Nieves
Current Estimated Value
Home Financials for this Owner
Home Financials are based on the most recent Mortgage that was taken out on this home.
Original Mortgage
$98,621
Outstanding Balance
$86,397
Interest Rate
3.5%
Mortgage Type
FHA
Estimated Equity
$139,631
Purchase Details
Closed on
Apr 6, 2007
Sold by
Vega Roobye F
Bought by
Morris Merrick B
Home Financials for this Owner
Home Financials are based on the most recent Mortgage that was taken out on this home.
Original Mortgage
$137,500
Interest Rate
6.25%
Mortgage Type
New Conventional
Purchase Details
Closed on
Nov 23, 2005
Sold by
Grier Clarence
Bought by
Vega Roobye
Home Financials for this Owner
Home Financials are based on the most recent Mortgage that was taken out on this home.
Original Mortgage
$131,840
Interest Rate
6.36%
Mortgage Type
New Conventional
Create a Home Valuation Report for This Property
The Home Valuation Report is an in-depth analysis detailing your home's value as well as a comparison with similar homes in the area
Home Values in the Area
Average Home Value in this Area
Purchase History
| Date | Buyer | Sale Price | Title Company |
|---|---|---|---|
| Machado Antonio Nieves | $137,911 | Attorney | |
| Morris Merrick B | $144,000 | -- | |
| Vega Roobye | $128,000 | -- |
Source: Public Records
Mortgage History
| Date | Status | Borrower | Loan Amount |
|---|---|---|---|
| Open | Machado Antonio Nieves | $98,621 | |
| Previous Owner | Morris Merrick B | $137,500 | |
| Previous Owner | Vega Roobye | $131,840 |
Source: Public Records
Tax History Compared to Growth
Tax History
| Year | Tax Paid | Tax Assessment Tax Assessment Total Assessment is a certain percentage of the fair market value that is determined by local assessors to be the total taxable value of land and additions on the property. | Land | Improvement |
|---|---|---|---|---|
| 2025 | $1,817 | $195,600 | $70,000 | $125,600 |
| 2024 | $1,817 | $187,300 | $70,000 | $117,300 |
| 2023 | $1,647 | $166,400 | $65,000 | $101,400 |
| 2022 | $1,448 | $146,300 | $53,000 | $93,300 |
| 2021 | $1,240 | $125,300 | $38,500 | $86,800 |
| 2020 | $1,218 | $119,700 | $38,500 | $81,200 |
| 2019 | $1,131 | $111,200 | $38,500 | $72,700 |
| 2018 | $1,115 | $111,200 | $38,500 | $72,700 |
| 2017 | $1,085 | $108,200 | $37,000 | $71,200 |
| 2016 | $1,040 | $105,000 | $35,300 | $69,700 |
| 2015 | $954 | $96,400 | $31,500 | $64,900 |
| 2014 | $849 | $92,100 | $31,500 | $60,600 |
Source: Public Records
Map
Nearby Homes
- 5606 Dodington Ct
- 5589 Baccalaureate Dr
- 809 S Buckingham Ct
- 5652 Dodington Ct
- 809 Pencil Box Way
- 5618 Baccalaureate Dr
- 5536 Frog Pond Ln
- 1037 Gas Light Ln
- 813 Gas Light Ln
- 5528 Goose Pond Ln
- 864 Gas Light Ln
- 5671 Caxton Ct
- 802 Diploma Ct
- 5500 Taylors Walke Ln
- 5501 Sadie Ln
- 900 Monarch Dr
- 902 Monarch Dr
- 5555 Lynbrook Landing
- 5549 Lynbrook Landing
- 5512 Lynbrook Landing
- 5740 Weblin Dr
- 5744 Weblin Dr
- 5738 Weblin Dr
- 5736 Weblin Dr
- 761 Hampshire Ln
- 763 Hampshire Ln
- 765 Hampshire Ln
- 806 Stephanie Ct Unit Ct
- 806 Stephanie Ct
- 767 Hampshire Ln
- 800 Stephanie Ct
- 802 Stephanie Ct
- 804 Stephanie Ct
- 808 Stephanie Ct
- 810 Stephanie Ct
- 769 Hampshire Ln
- 5743 Weblin Dr
- 5745 Weblin Dr
- 5741 Weblin Dr
- 812 Stephanie Ct