Estimated Value: $394,233 - $430,000
3
Beds
1
Bath
1,114
Sq Ft
$375/Sq Ft
Est. Value
About This Home
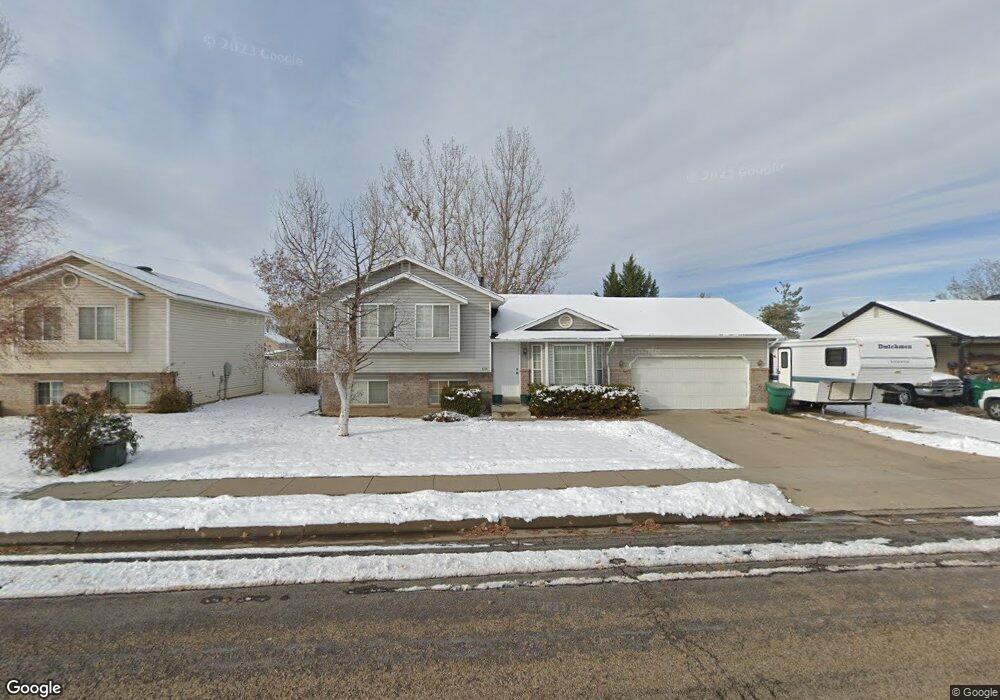
This home is located at 5743 S 4075 W, Roy, UT 84067 and is currently estimated at $417,808, approximately $375 per square foot. 5743 S 4075 W is a home located in Weber County with nearby schools including Freedom School, Roy Junior High School, and Roy High School.
Ownership History
Date
Name
Owned For
Owner Type
Purchase Details
Closed on
Apr 9, 2010
Sold by
Loftus Johnny Brett and Loftus Ashley
Bought by
Loftus Johnny Brett
Current Estimated Value
Home Financials for this Owner
Home Financials are based on the most recent Mortgage that was taken out on this home.
Original Mortgage
$105,000
Interest Rate
4.34%
Mortgage Type
New Conventional
Purchase Details
Closed on
Nov 24, 1998
Sold by
Loftus Johnny Brett and Loftus Ashley
Bought by
Loftus Johnny Brett and Loftus Ashley
Home Financials for this Owner
Home Financials are based on the most recent Mortgage that was taken out on this home.
Original Mortgage
$84,000
Interest Rate
6.52%
Purchase Details
Closed on
Apr 23, 1996
Sold by
Jones Ashley and Loftus Ashley
Bought by
Loftus Johnny Brett and Loftus Ashley
Create a Home Valuation Report for This Property
The Home Valuation Report is an in-depth analysis detailing your home's value as well as a comparison with similar homes in the area
Home Values in the Area
Average Home Value in this Area
Purchase History
| Date | Buyer | Sale Price | Title Company |
|---|---|---|---|
| Loftus Johnny Brett | -- | Executive Title Ogden | |
| Loftus Johnny Brett | -- | Mountain View Title | |
| Loftus Johnny Brett | -- | -- |
Source: Public Records
Mortgage History
| Date | Status | Borrower | Loan Amount |
|---|---|---|---|
| Closed | Loftus Johnny Brett | $105,000 | |
| Closed | Loftus Johnny Brett | $84,000 |
Source: Public Records
Tax History
| Year | Tax Paid | Tax Assessment Tax Assessment Total Assessment is a certain percentage of the fair market value that is determined by local assessors to be the total taxable value of land and additions on the property. | Land | Improvement |
|---|---|---|---|---|
| 2025 | $2,160 | $382,632 | $135,000 | $247,632 |
| 2024 | $2,090 | $205,149 | $74,257 | $130,892 |
| 2023 | $2,019 | $198,550 | $65,968 | $132,582 |
| 2022 | $2,279 | $228,250 | $60,501 | $167,749 |
| 2021 | $1,709 | $284,000 | $80,017 | $203,983 |
| 2020 | $1,550 | $236,000 | $80,017 | $155,983 |
| 2019 | $1,614 | $232,000 | $45,048 | $186,952 |
| 2018 | $1,464 | $199,000 | $39,924 | $159,076 |
| 2017 | $1,358 | $174,000 | $39,924 | $134,076 |
| 2016 | $1,285 | $88,750 | $21,415 | $67,335 |
| 2015 | $1,112 | $79,273 | $21,415 | $57,858 |
| 2014 | $1,026 | $72,273 | $18,611 | $53,662 |
Source: Public Records
Map
Nearby Homes
Your Personal Tour Guide
Ask me questions while you tour the home.