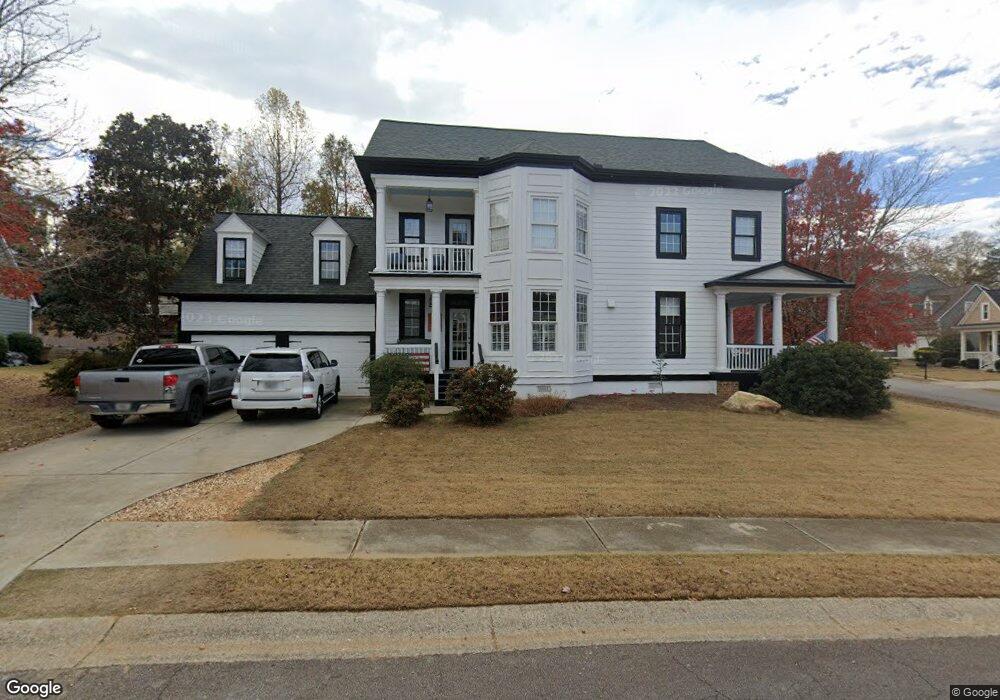
5744 Community Ln Hoschton, GA 30548
Estimated Value: $557,000 - $643,000
3
Beds
3
Baths
2,880
Sq Ft
$207/Sq Ft
Est. Value
About This Home
This home is located at 5744 Community Ln, Hoschton, GA 30548 and is currently estimated at $596,659, approximately $207 per square foot. 5744 Community Ln is a home located in Hall County with nearby schools including Spout Springs Elementary School, Cherokee Bluff Middle School, and Cherokee Bluff High School.
Ownership History
Date
Name
Owned For
Owner Type
Purchase Details
Closed on
Jul 21, 2006
Sold by
Ballman Mark and Ballman Julie L
Bought by
Martorano Jason M and Martorano Rosalind R
Current Estimated Value
Home Financials for this Owner
Home Financials are based on the most recent Mortgage that was taken out on this home.
Original Mortgage
$56,400
Outstanding Balance
$4,025
Interest Rate
9.37%
Mortgage Type
Unknown
Estimated Equity
$592,634
Purchase Details
Closed on
Sep 27, 2002
Sold by
John Wieland Homes & Neighborhoo
Bought by
Ballman Mark L and Ballman Julie L
Home Financials for this Owner
Home Financials are based on the most recent Mortgage that was taken out on this home.
Original Mortgage
$200,150
Interest Rate
5.38%
Mortgage Type
New Conventional
Purchase Details
Closed on
Nov 21, 2001
Sold by
Reunion Land Llc
Bought by
John Wieland Homes And Neighborhood Inc
Create a Home Valuation Report for This Property
The Home Valuation Report is an in-depth analysis detailing your home's value as well as a comparison with similar homes in the area
Home Values in the Area
Average Home Value in this Area
Purchase History
| Date | Buyer | Sale Price | Title Company |
|---|---|---|---|
| Martorano Jason M | $282,000 | -- | |
| Ballman Mark L | $250,300 | -- | |
| John Wieland Homes And Neighborhood Inc | $602,000 | -- |
Source: Public Records
Mortgage History
| Date | Status | Borrower | Loan Amount |
|---|---|---|---|
| Open | Martorano Jason M | $56,400 | |
| Open | Martorano Jason M | $225,600 | |
| Previous Owner | Ballman Mark L | $200,150 |
Source: Public Records
Tax History Compared to Growth
Tax History
| Year | Tax Paid | Tax Assessment Tax Assessment Total Assessment is a certain percentage of the fair market value that is determined by local assessors to be the total taxable value of land and additions on the property. | Land | Improvement |
|---|---|---|---|---|
| 2025 | $5,236 | $216,560 | $29,720 | $186,840 |
| 2024 | $6,031 | $240,840 | $33,880 | $206,960 |
| 2023 | $5,116 | $219,600 | $30,040 | $189,560 |
| 2022 | $3,969 | $150,840 | $29,720 | $121,120 |
| 2021 | $3,881 | $144,920 | $23,600 | $121,320 |
| 2020 | $3,575 | $129,400 | $19,240 | $110,160 |
| 2019 | $3,732 | $134,040 | $26,240 | $107,800 |
| 2018 | $3,293 | $114,160 | $17,480 | $96,680 |
| 2017 | $3,346 | $117,280 | $17,480 | $99,800 |
| 2016 | $2,924 | $104,640 | $17,480 | $87,160 |
| 2015 | $2,831 | $104,640 | $17,480 | $87,160 |
| 2014 | $2,831 | $100,560 | $17,480 | $83,080 |
Source: Public Records
Map
Nearby Homes
- 5703 Community Ln
- 1661 Friendship Rd
- 5830 Grand Reunion Dr
- 6416 Hickory Springs Cir Unit 6A
- 5425 Cordina Rd
- 5423 Olive Ln
- 5440 Olive Ln
- 5947 Maple Bluff Way
- 6352 Falling Water Ln Unit 6A
- 5517 Oak Knoll Ct
- 6009 Grand Reunion Dr
- 5825 Maple Bluff Way
- 6007 Cedar Wood Ct
- 6420 Rockpoint Ln
- 6001 Ash Hill Place
- 6146 Brookside Ln Unit 3
- 6213 Azalea Way
- 5783 Sierra Bend Way
- 6021 Ash Hill Place
- 7231 Grand Reunion Dr
- 5745 Porch Swing Place
- 5748 Community Ln
- 5743 Community Ln
- 5767 Tree Swing Ct
- 5771 Tree Swing Ct
- 5752 Community Ln Unit 408
- 5752 Community Ln
- 5739 Community Ln
- 5739 Community Ln Unit 403
- 5746 Porch Swing Place
- 5747 Community Ln
- 5736 Community Ln
- 5755 Community Ln
- 5751 Community Ln
- 5750 Porch Swing Place
- 5735 Community Ln
- 5775 Tree Swing Ct
- 5754 Porch Swing Place
- 5731 Community Ln
- 5762 Porch Swing Place