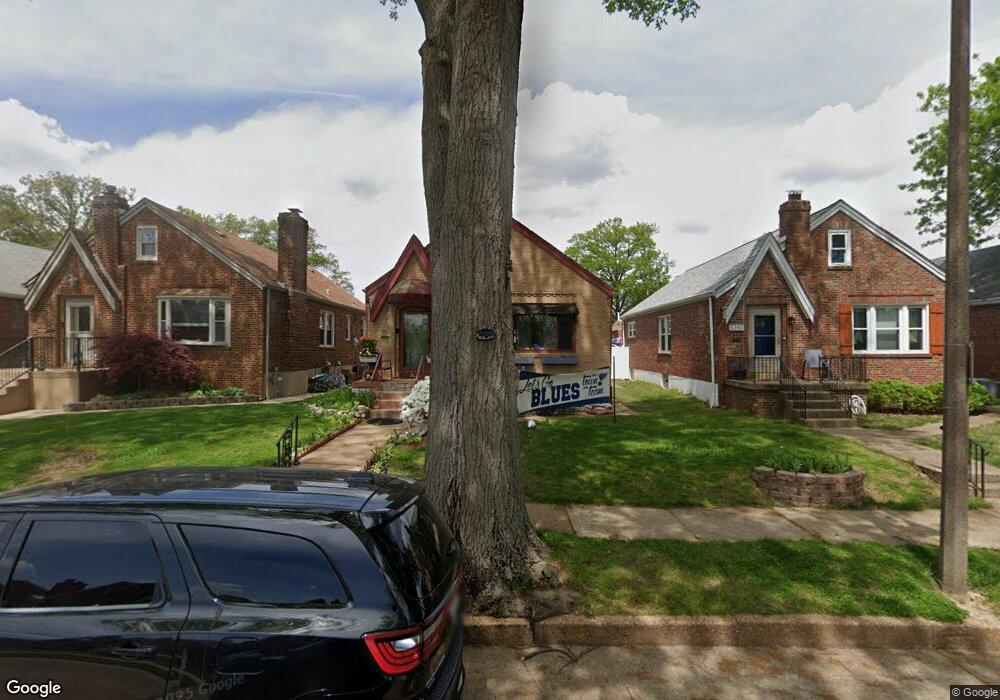
5747 Oleatha Ave Saint Louis, MO 63139
Northampton NeighborhoodEstimated Value: $282,000 - $318,000
--
Bed
1
Bath
2,176
Sq Ft
$137/Sq Ft
Est. Value
About This Home
This home is located at 5747 Oleatha Ave, Saint Louis, MO 63139 and is currently estimated at $297,455, approximately $136 per square foot. 5747 Oleatha Ave is a home located in St. Louis City with nearby schools including Mason Elementary School, Long International Middle School, and Roosevelt High School.
Ownership History
Date
Name
Owned For
Owner Type
Purchase Details
Closed on
Jan 19, 2021
Sold by
Carpenter Daniel N and Carpenter Erin M
Bought by
Daniel N Carpenter N and Daniel Erin M
Current Estimated Value
Purchase Details
Closed on
Mar 20, 2003
Sold by
Baumgarner Brian J and Baumgarner Heather M
Bought by
Carpenter Daniel N and Carpenter Erin M
Home Financials for this Owner
Home Financials are based on the most recent Mortgage that was taken out on this home.
Original Mortgage
$123,068
Interest Rate
5.77%
Mortgage Type
FHA
Purchase Details
Closed on
Dec 23, 1997
Sold by
Riganti Marc H and Riganti Caron W
Bought by
Baumgarner Brian J and Baumgarner Heather M
Home Financials for this Owner
Home Financials are based on the most recent Mortgage that was taken out on this home.
Original Mortgage
$81,369
Interest Rate
7.13%
Mortgage Type
FHA
Purchase Details
Closed on
Feb 27, 1997
Sold by
Jeanne Riganti
Bought by
Riganti Marc H and Riganti Joseph E
Create a Home Valuation Report for This Property
The Home Valuation Report is an in-depth analysis detailing your home's value as well as a comparison with similar homes in the area
Home Values in the Area
Average Home Value in this Area
Purchase History
| Date | Buyer | Sale Price | Title Company |
|---|---|---|---|
| Daniel N Carpenter N | -- | None Listed On Document | |
| Carpenter Daniel N | -- | None Available | |
| Carpenter Daniel N | -- | -- | |
| Baumgarner Brian J | -- | -- | |
| Riganti Marc H | -- | -- |
Source: Public Records
Mortgage History
| Date | Status | Borrower | Loan Amount |
|---|---|---|---|
| Previous Owner | Carpenter Daniel N | $123,068 | |
| Previous Owner | Baumgarner Brian J | $81,369 |
Source: Public Records
Tax History Compared to Growth
Tax History
| Year | Tax Paid | Tax Assessment Tax Assessment Total Assessment is a certain percentage of the fair market value that is determined by local assessors to be the total taxable value of land and additions on the property. | Land | Improvement |
|---|---|---|---|---|
| 2025 | $3,567 | $50,180 | $2,740 | $47,440 |
| 2024 | $3,393 | $42,280 | $2,740 | $39,540 |
| 2023 | $3,393 | $42,280 | $2,740 | $39,540 |
| 2022 | $3,253 | $39,010 | $2,740 | $36,270 |
| 2021 | $3,248 | $39,010 | $2,740 | $36,270 |
| 2020 | $3,055 | $36,960 | $2,740 | $34,220 |
| 2019 | $3,045 | $36,960 | $2,740 | $34,220 |
| 2018 | $2,687 | $31,580 | $2,740 | $28,840 |
| 2017 | $2,641 | $31,580 | $2,740 | $28,840 |
| 2016 | $2,412 | $28,440 | $2,740 | $25,710 |
| 2015 | $2,187 | $28,450 | $2,740 | $25,710 |
| 2014 | $2,128 | $28,450 | $2,740 | $25,710 |
| 2013 | -- | $27,690 | $2,740 | $24,950 |
Source: Public Records
Map
Nearby Homes
- 5701 Pernod Ave
- 5716 Pernod Ave
- 6041 Tholozan Ave
- 5736 Lindenwood Ave
- 6214 Oleatha Ave
- 5504 Mardel Ave
- 5700 Chippewa St
- 5630 Fyler Ave
- 7082 Oleatha Ave
- 5500 Lindenwood Ave
- 6325 Marquette Ave
- 6339 Marquette Ave
- 6300 Fyler Ave
- 5531 Arthur Ave
- 5425 Pernod Ave
- 3443 Sublette Ave
- 6411 Hancock Ave
- 3905 Tamm Ave
- 5340 Tholozan Ave
- 3807 Tamm Ave
- 5751 Oleatha Ave
- 5743 Oleatha Ave
- 5741 Oleatha Ave
- 5753 Oleatha Ave
- 5757 Oleatha Ave
- 5737 Oleatha Ave
- 5746 Potomac St
- 5744 Potomac St
- 5750 Potomac St
- 5733 Oleatha Ave
- 5763 Oleatha Ave
- 5752 Potomac St
- 5740 Potomac St
- 5756 Potomac St
- 5736 Potomac St
- 5748 Oleatha Ave
- 5729 Oleatha Ave
- 5744 Oleatha Ave
- 5750 Oleatha Ave
- 5734 Potomac St