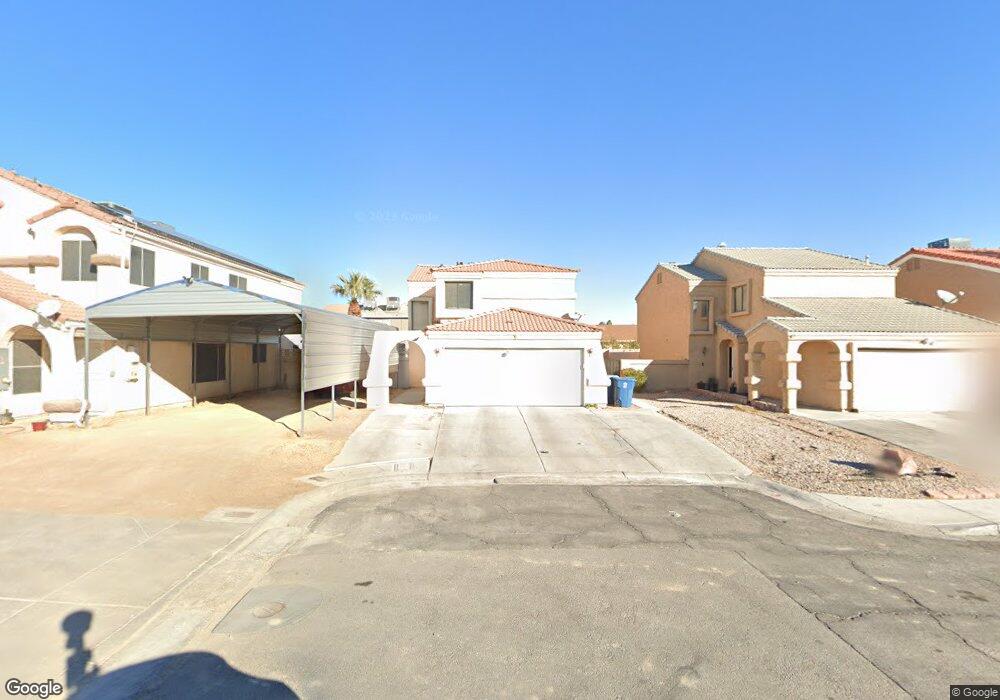
5748 Cinnabar Ave Unit 4 Las Vegas, NV 89110
Estimated Value: $353,000 - $404,000
3
Beds
3
Baths
1,692
Sq Ft
$227/Sq Ft
Est. Value
About This Home
This home is located at 5748 Cinnabar Ave Unit 4, Las Vegas, NV 89110 and is currently estimated at $384,389, approximately $227 per square foot. 5748 Cinnabar Ave Unit 4 is a home located in Clark County with nearby schools including Stanford Elementary School, Duane D. Keller Middle School, and Eldorado High School.
Ownership History
Date
Name
Owned For
Owner Type
Purchase Details
Closed on
Jun 30, 2017
Sold by
Licea Andres Diaz and Diaz Elizabeth
Bought by
Diaz Elizabeth
Current Estimated Value
Purchase Details
Closed on
Dec 6, 2013
Sold by
Callahan Bill
Bought by
Licea Andres Diaz and Diaz Elizabeth
Purchase Details
Closed on
Feb 16, 2011
Sold by
Bac Home Loans Servicing Lp
Bought by
Callahan Bill
Home Financials for this Owner
Home Financials are based on the most recent Mortgage that was taken out on this home.
Original Mortgage
$54,000
Interest Rate
4.96%
Mortgage Type
New Conventional
Purchase Details
Closed on
Sep 17, 2010
Sold by
Whalum Michael E and Whalum Antina
Bought by
Bac Home Loans Servicing Lp and Countrywide Home Loans Servicing Lp
Create a Home Valuation Report for This Property
The Home Valuation Report is an in-depth analysis detailing your home's value as well as a comparison with similar homes in the area
Home Values in the Area
Average Home Value in this Area
Purchase History
| Date | Buyer | Sale Price | Title Company |
|---|---|---|---|
| Diaz Elizabeth | -- | None Available | |
| Licea Andres Diaz | -- | None Available | |
| Licea Andres Diaz | $122,500 | Lawyers Title Of Nevada Cha | |
| Callahan Bill | $67,500 | Fidelity Rainbow | |
| Bac Home Loans Servicing Lp | $85,500 | Accommodation |
Source: Public Records
Mortgage History
| Date | Status | Borrower | Loan Amount |
|---|---|---|---|
| Previous Owner | Callahan Bill | $54,000 |
Source: Public Records
Tax History Compared to Growth
Tax History
| Year | Tax Paid | Tax Assessment Tax Assessment Total Assessment is a certain percentage of the fair market value that is determined by local assessors to be the total taxable value of land and additions on the property. | Land | Improvement |
|---|---|---|---|---|
| 2025 | $1,190 | $66,748 | $26,600 | $40,148 |
| 2024 | $1,157 | $66,748 | $26,600 | $40,148 |
| 2023 | $1,199 | $66,953 | $28,000 | $38,953 |
| 2022 | $1,165 | $59,295 | $23,450 | $35,845 |
| 2021 | $857 | $54,089 | $19,600 | $34,489 |
| 2020 | $793 | $54,122 | $19,600 | $34,522 |
| 2019 | $743 | $50,559 | $16,100 | $34,459 |
| 2018 | $709 | $46,822 | $13,650 | $33,172 |
| 2017 | $1,382 | $47,110 | $13,300 | $33,810 |
| 2016 | $665 | $43,173 | $8,750 | $34,423 |
| 2015 | $663 | $31,260 | $5,950 | $25,310 |
| 2014 | $642 | $21,239 | $4,200 | $17,039 |
Source: Public Records
Map
Nearby Homes
- 1345 Stokes St
- 5754 Cinnabar Ave
- 5772 Cinnabar Ave
- 5855 Feather Falls Cir
- 5801 Sunny Orchard Ln
- 1286 N Sloan Ln
- 1491 Sunrise View Dr
- 5717 Christchurch Ave
- 1654 Buck Island St
- 5383 E Washington Ave
- 1676 Buck Island St
- 5991 Corpus Christi Ct
- 4541 E Owens Ave
- 5923 Halehaven Dr
- 1325 Fairchild St
- 1667 Rockwell Ln
- 6030 Halehaven Dr
- 6165 Stanley Park Ave
- 1831 Castleberry Ln
- 910 N Sloan Ln Unit 201
- 5742 Cinnabar Ave
- 5760 Cinnabar Ave
- 5743 E Monroe Ave
- 5766 Cinnabar Ave
- 5763 E Monroe Ave Unit 3B
- 1370 Linn Ln
- 1380 Linn Ln
- 5741 Cinnabar Ave Unit 4
- 5733 E Monroe Ave
- 5747 Cinnabar Ave
- 1360 Linn Ln
- 5753 Cinnabar Ave
- 5773 E Monroe Ave
- 5699 E Monroe Ave
- 1350 Linn Ln Unit 6
- 5778 Cinnabar Ave
- 1349 Stokes St
- 1356 Stokes St
- 5783 E Monroe Ave
- 5752 E Monroe Ave