Estimated Value: $407,000 - $565,000
4
Beds
3
Baths
1,898
Sq Ft
$254/Sq Ft
Est. Value
About This Home
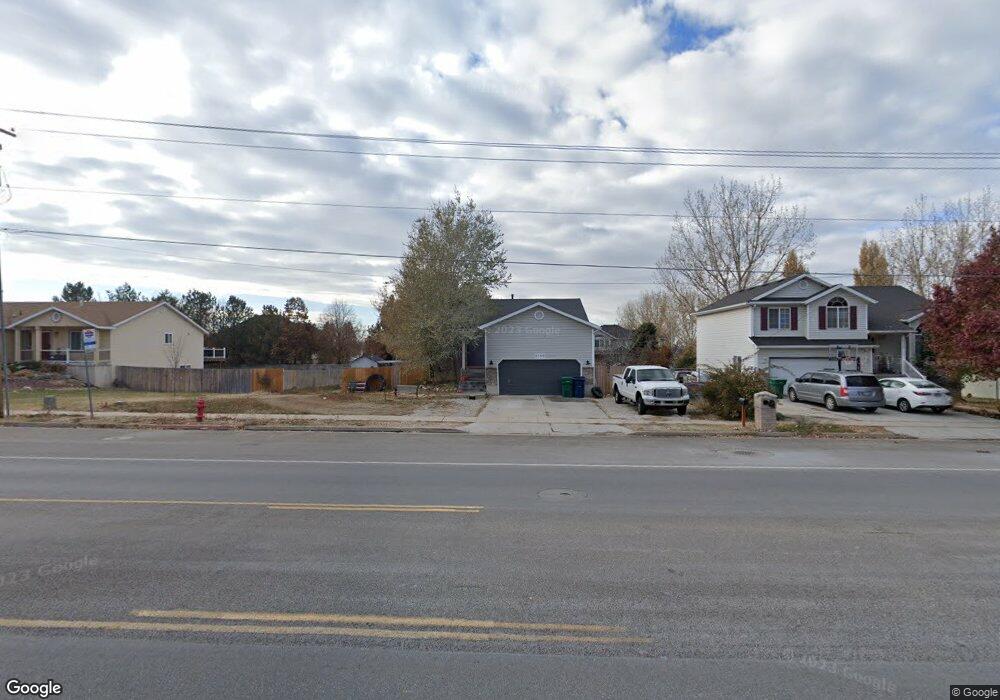
This home is located at 5749 S 3500 W, Roy, UT 84067 and is currently estimated at $482,993, approximately $254 per square foot. 5749 S 3500 W is a home located in Weber County with nearby schools including Midland School, Roy Junior High School, and Roy High School.
Ownership History
Date
Name
Owned For
Owner Type
Purchase Details
Closed on
Jan 22, 2020
Sold by
Breckenridge Property Fund 2016 Llc
Bought by
Clark Bradley A and Lakk Monika
Current Estimated Value
Home Financials for this Owner
Home Financials are based on the most recent Mortgage that was taken out on this home.
Original Mortgage
$303,610
Outstanding Balance
$268,768
Interest Rate
3.7%
Mortgage Type
New Conventional
Estimated Equity
$214,225
Purchase Details
Closed on
Oct 4, 2019
Sold by
Martinez Jahir and Frampton Cheyenne
Bought by
Breckenridge Property Fund 2016 Llc
Purchase Details
Closed on
May 24, 2016
Bought by
Martinez Jahir
Home Financials for this Owner
Home Financials are based on the most recent Mortgage that was taken out on this home.
Original Mortgage
$192,940
Interest Rate
3.58%
Purchase Details
Closed on
Jun 15, 2011
Sold by
Flamm Matthew and Flamm Kevin
Bought by
Godfrey Austin T and Nguyen Anhnhung Tran
Home Financials for this Owner
Home Financials are based on the most recent Mortgage that was taken out on this home.
Original Mortgage
$149,608
Interest Rate
4.25%
Mortgage Type
FHA
Purchase Details
Closed on
Feb 13, 2002
Sold by
Hyde Tucker S
Bought by
Lewis Nicole S
Home Financials for this Owner
Home Financials are based on the most recent Mortgage that was taken out on this home.
Original Mortgage
$125,000
Interest Rate
7.13%
Purchase Details
Closed on
Nov 29, 2000
Sold by
Steven Hyde Construction
Bought by
Hyde Tucker S
Home Financials for this Owner
Home Financials are based on the most recent Mortgage that was taken out on this home.
Original Mortgage
$119,632
Interest Rate
7.86%
Mortgage Type
FHA
Purchase Details
Closed on
May 31, 2000
Sold by
Steven Hyde Construction
Bought by
Hyde Steven and Hyde Tucker
Purchase Details
Closed on
Sep 18, 1998
Sold by
Steve Hyde Homes
Bought by
Steven Hyde Construction
Home Financials for this Owner
Home Financials are based on the most recent Mortgage that was taken out on this home.
Original Mortgage
$107,200
Interest Rate
6.89%
Purchase Details
Closed on
Sep 1, 1998
Sold by
Keepsake Homes Llc
Bought by
Steve Hyde Homes
Home Financials for this Owner
Home Financials are based on the most recent Mortgage that was taken out on this home.
Original Mortgage
$107,200
Interest Rate
6.89%
Create a Home Valuation Report for This Property
The Home Valuation Report is an in-depth analysis detailing your home's value as well as a comparison with similar homes in the area
Home Values in the Area
Average Home Value in this Area
Purchase History
| Date | Buyer | Sale Price | Title Company |
|---|---|---|---|
| Clark Bradley A | -- | Inwest Title Services Inc | |
| Breckenridge Property Fund 2016 Llc | -- | Richland Title Ins Agcy I | |
| Martinez Jahir | -- | -- | |
| Godfrey Austin T | -- | Bonneville Superior Title Co | |
| Lewis Nicole S | -- | -- | |
| Hyde Tucker S | -- | American Preferred Title | |
| Hyde Steven | -- | U S Title | |
| Steven Hyde Construction | -- | Bonneville Title Company | |
| Steve Hyde Homes | -- | Bonneville Title Company |
Source: Public Records
Mortgage History
| Date | Status | Borrower | Loan Amount |
|---|---|---|---|
| Open | Clark Bradley A | $303,610 | |
| Previous Owner | Martinez Jahir | $192,940 | |
| Previous Owner | Martinez Jahir | -- | |
| Previous Owner | Godfrey Austin T | $149,608 | |
| Previous Owner | Lewis Nicole S | $125,000 | |
| Previous Owner | Hyde Tucker S | $119,632 | |
| Previous Owner | Steven Hyde Construction | $107,200 |
Source: Public Records
Tax History Compared to Growth
Tax History
| Year | Tax Paid | Tax Assessment Tax Assessment Total Assessment is a certain percentage of the fair market value that is determined by local assessors to be the total taxable value of land and additions on the property. | Land | Improvement |
|---|---|---|---|---|
| 2025 | $2,661 | $418,544 | $150,299 | $268,245 |
| 2024 | $2,600 | $226,599 | $82,663 | $143,936 |
| 2023 | $2,565 | $224,400 | $82,435 | $141,965 |
| 2022 | $2,476 | $221,650 | $65,960 | $155,690 |
| 2021 | $2,136 | $315,000 | $72,900 | $242,100 |
| 2020 | $1,981 | $268,000 | $72,900 | $195,100 |
| 2019 | $1,880 | $239,000 | $55,581 | $183,419 |
| 2018 | $1,841 | $221,000 | $55,581 | $165,419 |
| 2017 | $1,860 | $211,000 | $55,358 | $155,642 |
| 2016 | $1,691 | $102,472 | $30,369 | $72,103 |
| 2015 | $1,455 | $89,180 | $35,831 | $53,349 |
| 2014 | $1,473 | $89,651 | $35,831 | $53,820 |
Source: Public Records
Map
Nearby Homes