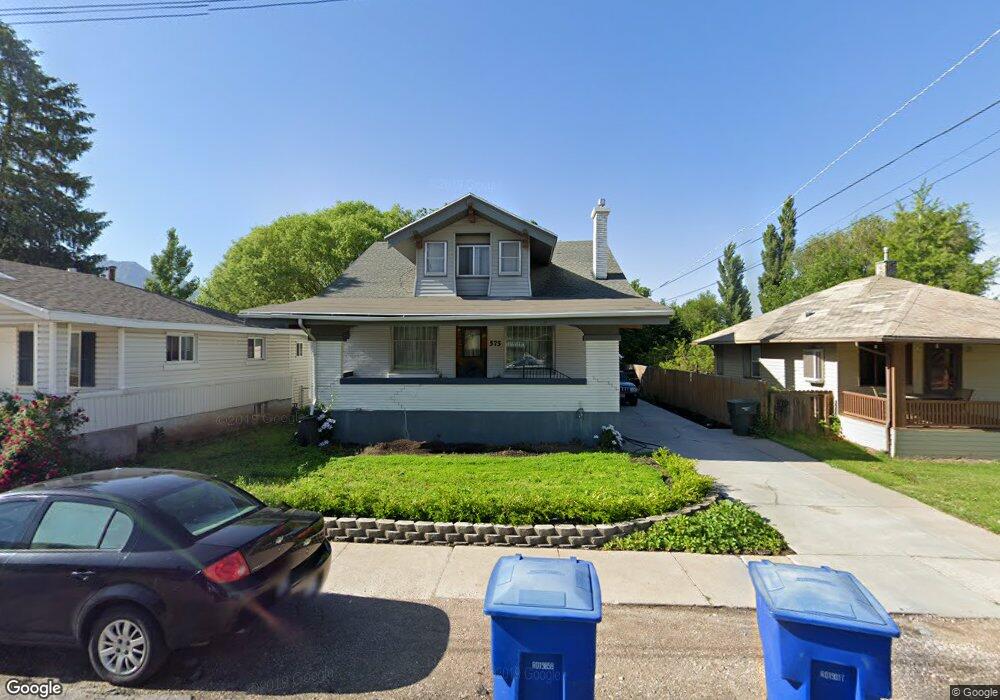
575 13th St Ogden, UT 84404
Canyon Road NeighborhoodEstimated Value: $460,000 - $558,000
5
Beds
3
Baths
3,700
Sq Ft
$133/Sq Ft
Est. Value
About This Home
This home is located at 575 13th St, Ogden, UT 84404 and is currently estimated at $493,918, approximately $133 per square foot. 575 13th St is a home located in Weber County with nearby schools including New Bridge School, Mound Fort Junior High School, and Ben Lomond High School.
Ownership History
Date
Name
Owned For
Owner Type
Purchase Details
Closed on
Jul 8, 2022
Sold by
Grayson Greener
Bought by
Greener Grayson
Current Estimated Value
Home Financials for this Owner
Home Financials are based on the most recent Mortgage that was taken out on this home.
Original Mortgage
$136,600
Outstanding Balance
$114,624
Interest Rate
4.32%
Mortgage Type
Balloon
Estimated Equity
$379,294
Purchase Details
Closed on
Jun 23, 2017
Sold by
Sa Truong Dev Llc
Bought by
Greener Grayson
Home Financials for this Owner
Home Financials are based on the most recent Mortgage that was taken out on this home.
Original Mortgage
$155,000
Interest Rate
4.05%
Mortgage Type
New Conventional
Purchase Details
Closed on
Aug 11, 2015
Sold by
Reverse Mortgage Solutions Inc
Bought by
Sa Truong Dev Llc
Purchase Details
Closed on
Oct 1, 2001
Sold by
Brill Carroll E
Bought by
Welch Marlene
Home Financials for this Owner
Home Financials are based on the most recent Mortgage that was taken out on this home.
Original Mortgage
$110,000
Interest Rate
6.9%
Create a Home Valuation Report for This Property
The Home Valuation Report is an in-depth analysis detailing your home's value as well as a comparison with similar homes in the area
Home Values in the Area
Average Home Value in this Area
Purchase History
| Date | Buyer | Sale Price | Title Company |
|---|---|---|---|
| Greener Grayson | -- | Title Guarantee | |
| Greener Grayson | -- | Title One | |
| Sa Truong Dev Llc | $110,000 | Highland Title | |
| Welch Marlene | -- | Western States Title |
Source: Public Records
Mortgage History
| Date | Status | Borrower | Loan Amount |
|---|---|---|---|
| Open | Greener Grayson | $136,600 | |
| Previous Owner | Greener Grayson | $155,000 | |
| Previous Owner | Welch Marlene | $110,000 |
Source: Public Records
Tax History
| Year | Tax Paid | Tax Assessment Tax Assessment Total Assessment is a certain percentage of the fair market value that is determined by local assessors to be the total taxable value of land and additions on the property. | Land | Improvement |
|---|---|---|---|---|
| 2025 | $3,162 | $463,631 | $95,089 | $368,542 |
| 2024 | $3,063 | $242,548 | $52,313 | $190,235 |
| 2023 | $2,733 | $217,800 | $50,513 | $167,287 |
| 2022 | $3,332 | $266,200 | $45,146 | $221,054 |
| 2021 | $2,677 | $355,000 | $42,413 | $312,587 |
| 2020 | $2,245 | $275,000 | $32,913 | $242,087 |
| 2019 | $2,156 | $248,000 | $29,804 | $218,196 |
| 2018 | $1,978 | $226,001 | $29,804 | $196,197 |
| 2017 | $1,696 | $181,000 | $24,427 | $156,573 |
| 2016 | $1,490 | $85,966 | $13,616 | $72,350 |
| 2015 | $1,495 | $84,181 | $13,616 | $70,565 |
| 2014 | $1,528 | $84,180 | $10,918 | $73,262 |
Source: Public Records
Map
Nearby Homes
- 1413 S Jefferson Ave
- 506 14th St
- 1424 Jefferson Ave
- 486 15th St
- 443 E 1415 S Unit 118
- 439 E 1415 S Unit 117
- 433 E 1415 S Unit 116
- 1529 Jefferson Ave
- 425 E 1415 S Unit 114
- 1442 S 410 E Unit 134
- 1446 S 410 E Unit 135
- 1107 Jefferson Ave
- 1110 Jefferson Ave
- 1324 Liberty Ave
- 1504 Washington Blvd
- 360 13th St
- 1502 Liberty Ave
- 507 Canyon Rd
- 344 13th St
- 968 S Jefferson Ave
- 571 13th St
- 581 13th St
- 1315 S Jefferson Ave
- 1315 Jefferson Ave
- 567 13th St
- 1301 Jefferson Ave
- 1323 Jefferson Ave
- 555 13th St
- 1268 Porter Ave
- 1351 Jefferson Ave
- 3516 S Jefferson Ave
- 3601 S Jefferson Ave
- 3325 S Jefferson Ave
- 3443 S Jefferson Ave
- 104 S Jefferson Ave
- 2049 S Jefferson Ave
- 568 14th St
- 576 13th St
- 582 13th St
- 1262 Porter Ave
Your Personal Tour Guide
Ask me questions while you tour the home.