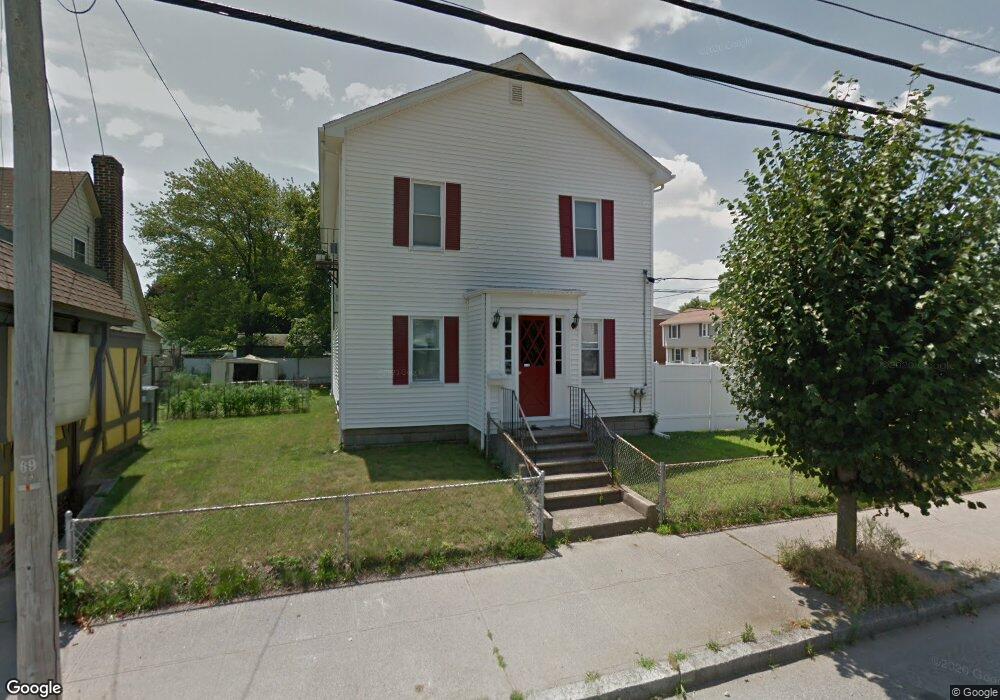
575 Benefit St Pawtucket, RI 02861
Darlington NeighborhoodEstimated Value: $375,467 - $546,000
5
Beds
2
Baths
2,052
Sq Ft
$243/Sq Ft
Est. Value
About This Home
This home is located at 575 Benefit St, Pawtucket, RI 02861 and is currently estimated at $497,617, approximately $242 per square foot. 575 Benefit St is a home located in Providence County with nearby schools including St Cecilia School and Dayspring Christian Academy.
Ownership History
Date
Name
Owned For
Owner Type
Purchase Details
Closed on
Jun 16, 2025
Sold by
Sousa Fernando J and Sousa Helena
Bought by
Fshs Holdings Llc
Current Estimated Value
Purchase Details
Closed on
Dec 22, 2008
Sold by
Wells Fargo Bank Na
Bought by
Sousa Fernando J
Purchase Details
Closed on
Mar 27, 2008
Sold by
Marcott Adam
Bought by
Wells Fargo Bank Na
Purchase Details
Closed on
Sep 23, 2002
Sold by
Mathieu Raymond
Bought by
Santos April M and Brovsseau Jacques L
Home Financials for this Owner
Home Financials are based on the most recent Mortgage that was taken out on this home.
Original Mortgage
$137,837
Interest Rate
6.36%
Create a Home Valuation Report for This Property
The Home Valuation Report is an in-depth analysis detailing your home's value as well as a comparison with similar homes in the area
Home Values in the Area
Average Home Value in this Area
Purchase History
| Date | Buyer | Sale Price | Title Company |
|---|---|---|---|
| Fshs Holdings Llc | -- | None Available | |
| Fshs Holdings Llc | -- | None Available | |
| Sousa Fernando J | $105,000 | -- | |
| Sousa Fernando J | $105,000 | -- | |
| Wells Fargo Bank Na | $191,250 | -- | |
| Wells Fargo Bank Na | $191,250 | -- | |
| Santos April M | $140,000 | -- | |
| Santos April M | $140,000 | -- |
Source: Public Records
Mortgage History
| Date | Status | Borrower | Loan Amount |
|---|---|---|---|
| Previous Owner | Santos April M | $137,837 |
Source: Public Records
Tax History Compared to Growth
Tax History
| Year | Tax Paid | Tax Assessment Tax Assessment Total Assessment is a certain percentage of the fair market value that is determined by local assessors to be the total taxable value of land and additions on the property. | Land | Improvement |
|---|---|---|---|---|
| 2025 | $4,566 | $347,200 | $98,100 | $249,100 |
| 2024 | $4,284 | $347,200 | $98,100 | $249,100 |
| 2023 | $4,225 | $249,400 | $72,600 | $176,800 |
| 2022 | $4,135 | $249,400 | $72,600 | $176,800 |
| 2021 | $4,135 | $249,400 | $72,600 | $176,800 |
| 2020 | $3,833 | $183,500 | $65,500 | $118,000 |
| 2019 | $3,833 | $183,500 | $65,500 | $118,000 |
| 2018 | $3,694 | $183,500 | $65,500 | $118,000 |
| 2017 | $3,294 | $145,000 | $54,800 | $90,200 |
| 2016 | $3,174 | $145,000 | $54,800 | $90,200 |
| 2015 | $3,174 | $145,000 | $54,800 | $90,200 |
| 2014 | $3,037 | $131,700 | $49,300 | $82,400 |
Source: Public Records
Map
Nearby Homes