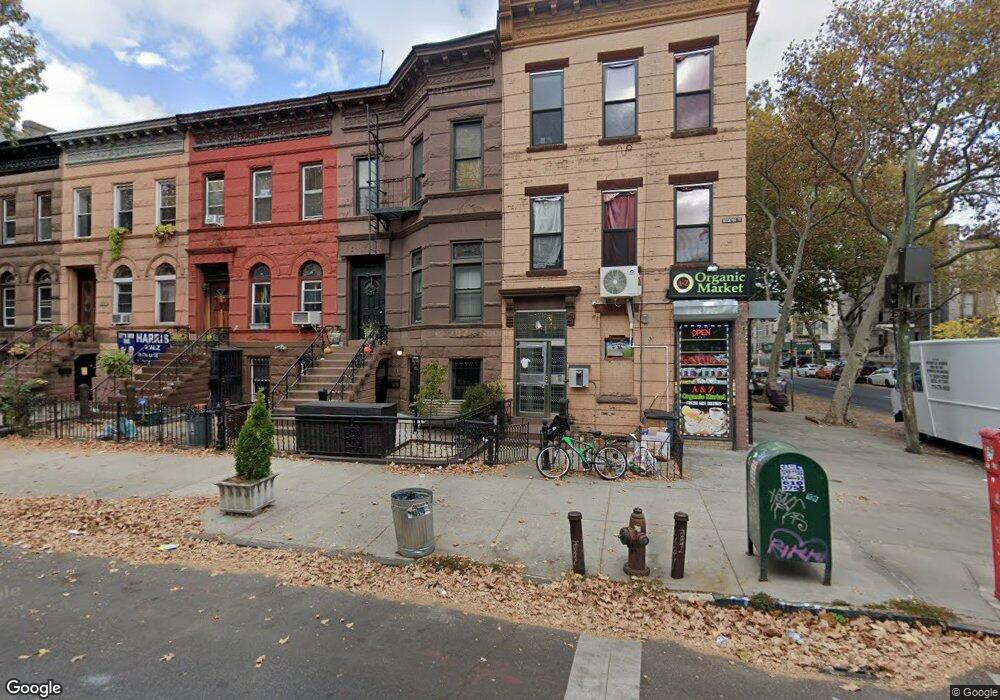
575 Decatur St Brooklyn, NY 11233
Bed-Stuy NeighborhoodEstimated Value: $1,368,000 - $1,804,000
--
Bed
--
Bath
2,700
Sq Ft
$592/Sq Ft
Est. Value
About This Home
This home is located at 575 Decatur St, Brooklyn, NY 11233 and is currently estimated at $1,598,006, approximately $591 per square foot. 575 Decatur St is a home located in Kings County with nearby schools including P.S. 40 George W Carver, Success Academy Charter School-NYC 9, and Brooklyn Ascend Charter School.
Ownership History
Date
Name
Owned For
Owner Type
Purchase Details
Closed on
Nov 12, 2020
Sold by
Bartlett Chris L and Bartlett Dawn N
Bought by
Seamans Henry and Webb Seth
Current Estimated Value
Home Financials for this Owner
Home Financials are based on the most recent Mortgage that was taken out on this home.
Original Mortgage
$524,541
Outstanding Balance
$464,632
Interest Rate
2.8%
Mortgage Type
New Conventional
Estimated Equity
$1,133,374
Purchase Details
Closed on
Jan 6, 2012
Sold by
Brenda Earle As Successor Trustee Of and Loriece Hackney Revocable Living Trust
Bought by
Bartlett Chris L and Bartlett Dawn N
Home Financials for this Owner
Home Financials are based on the most recent Mortgage that was taken out on this home.
Original Mortgage
$611,041
Interest Rate
4.25%
Mortgage Type
FHA
Purchase Details
Closed on
Jun 19, 2006
Sold by
Hackney Loriece
Bought by
Loriece Hackney As Trustee Of The Lorie
Create a Home Valuation Report for This Property
The Home Valuation Report is an in-depth analysis detailing your home's value as well as a comparison with similar homes in the area
Home Values in the Area
Average Home Value in this Area
Purchase History
| Date | Buyer | Sale Price | Title Company |
|---|---|---|---|
| Seamans Henry | $1,480,000 | -- | |
| Seamans Henry | $1,480,000 | -- | |
| Bartlett Chris L | $482,500 | -- | |
| Bartlett Chris L | $482,500 | -- | |
| Loriece Hackney As Trustee Of The Lorie | -- | -- | |
| Loriece Hackney As Trustee Of The Lorie | -- | -- |
Source: Public Records
Mortgage History
| Date | Status | Borrower | Loan Amount |
|---|---|---|---|
| Open | Seamans Henry | $524,541 | |
| Closed | Seamans Henry | $524,541 | |
| Previous Owner | Bartlett Chris L | $611,041 | |
| Closed | Loriece Hackney As Trustee Of The Lorie | $0 |
Source: Public Records
Tax History Compared to Growth
Tax History
| Year | Tax Paid | Tax Assessment Tax Assessment Total Assessment is a certain percentage of the fair market value that is determined by local assessors to be the total taxable value of land and additions on the property. | Land | Improvement |
|---|---|---|---|---|
| 2025 | $4,922 | $94,560 | $19,800 | $74,760 |
| 2024 | $4,922 | $106,560 | $19,800 | $86,760 |
| 2023 | $4,715 | $112,800 | $19,800 | $93,000 |
| 2022 | $4,635 | $99,480 | $19,800 | $79,680 |
| 2021 | $4,821 | $77,220 | $19,800 | $57,420 |
| 2020 | $1,118 | $78,900 | $19,800 | $59,100 |
| 2019 | $4,272 | $86,280 | $19,800 | $66,480 |
| 2018 | $3,944 | $19,347 | $4,028 | $15,319 |
| 2017 | $3,944 | $19,347 | $5,307 | $14,040 |
| 2016 | $3,195 | $19,090 | $7,070 | $12,020 |
| 2015 | $1,763 | $18,014 | $10,017 | $7,997 |
| 2014 | $1,763 | $17,017 | $10,532 | $6,485 |
Source: Public Records
Map
Nearby Homes
- 576 Decatur St
- 605 Decatur St
- 686 Macdonough St Unit 3A
- 764 Macon St Unit 4 B
- 635 Macdonough St
- 397 Bainbridge St
- 794 Macon St
- 186 Howard Ave
- 473 Bainbridge St Unit 1
- 473 Bainbridge St Unit 1-A
- 473 Bainbridge St Unit 2-B
- 479 Bainbridge St
- 479 Bainbridge St Unit Townhouse
- 711 Macdonough St
- 761 Macon St
- 608 Macdonough St
- 521 Decatur St
- 816 Halsey St
- 206 Howard Ave
- 300 Chauncey St
- 573 Decatur St
- 571 Decatur St
- 569 Decatur St
- 567 Decatur St
- 567 Decatur St Unit 1F
- 567 Decatur St Unit 4 B
- 567 Decatur St Unit 4 R
- 567 Decatur St Unit 2 F
- 567 Decatur St
- 567 Decatur St Unit 3-R
- 565 Decatur St
- 565 Decatur St Unit 3
- 155 Howard Ave
- 577 Decatur St Unit 2
- 577 Decatur St
- 644-646 Macdonough St
- 563 Decatur St
- 563 Decatur St Unit 2
- 579 Decatur St
- 579 Decatur St Unit 1