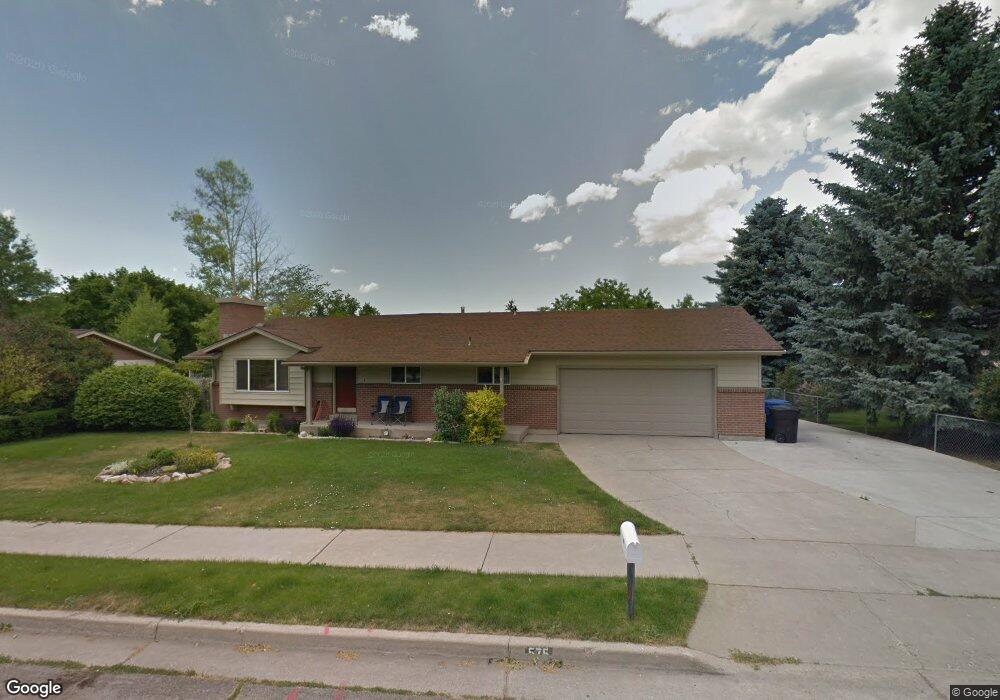
575 Maple Dr Smithfield, UT 84335
Estimated Value: $418,000 - $458,000
4
Beds
4
Baths
2,418
Sq Ft
$181/Sq Ft
Est. Value
About This Home
This home is located at 575 Maple Dr, Smithfield, UT 84335 and is currently estimated at $436,870, approximately $180 per square foot. 575 Maple Dr is a home located in Cache County with nearby schools including Birch Creek School, North Cache Middle School, and White Pine Middle School.
Ownership History
Date
Name
Owned For
Owner Type
Purchase Details
Closed on
Jul 8, 2013
Sold by
Pattee Chris A and Pattee Kristi N
Bought by
Hollingshead Kiffin N
Current Estimated Value
Home Financials for this Owner
Home Financials are based on the most recent Mortgage that was taken out on this home.
Original Mortgage
$175,000
Outstanding Balance
$126,209
Interest Rate
3.88%
Mortgage Type
New Conventional
Estimated Equity
$310,661
Purchase Details
Closed on
May 21, 2007
Sold by
Christley Robert L and Christley Zonna
Bought by
Pattee Chris A and Pattee Kristi N
Home Financials for this Owner
Home Financials are based on the most recent Mortgage that was taken out on this home.
Original Mortgage
$162,000
Interest Rate
6.18%
Mortgage Type
New Conventional
Create a Home Valuation Report for This Property
The Home Valuation Report is an in-depth analysis detailing your home's value as well as a comparison with similar homes in the area
Home Values in the Area
Average Home Value in this Area
Purchase History
| Date | Buyer | Sale Price | Title Company |
|---|---|---|---|
| Hollingshead Kiffin N | -- | Northern Title Company | |
| Hollingshead Kiffin N | -- | Northern Title Company | |
| Pattee Chris A | -- | Hickman Land Title Company |
Source: Public Records
Mortgage History
| Date | Status | Borrower | Loan Amount |
|---|---|---|---|
| Open | Hollingshead Kiffin N | $175,000 | |
| Closed | Hollingshead Kiffin N | $175,000 | |
| Previous Owner | Pattee Chris A | $162,000 |
Source: Public Records
Tax History
| Year | Tax Paid | Tax Assessment Tax Assessment Total Assessment is a certain percentage of the fair market value that is determined by local assessors to be the total taxable value of land and additions on the property. | Land | Improvement |
|---|---|---|---|---|
| 2025 | $1,580 | $211,480 | $0 | $0 |
| 2024 | $1,534 | $192,700 | $0 | $0 |
| 2023 | $1,596 | $189,560 | $0 | $0 |
| 2022 | $1,622 | $189,555 | $0 | $0 |
| 2021 | $157 | $281,040 | $69,000 | $212,040 |
| 2020 | $1,475 | $245,700 | $69,000 | $176,700 |
| 2019 | $1,365 | $216,768 | $44,300 | $172,468 |
| 2018 | $1,241 | $190,460 | $44,300 | $146,160 |
| 2017 | $1,146 | $96,140 | $0 | $0 |
| 2016 | $1,166 | $96,140 | $0 | $0 |
| 2015 | $1,171 | $96,140 | $0 | $0 |
| 2014 | $996 | $83,405 | $0 | $0 |
| 2013 | -- | $83,405 | $0 | $0 |
Source: Public Records
Map
Nearby Homes
Your Personal Tour Guide
Ask me questions while you tour the home.