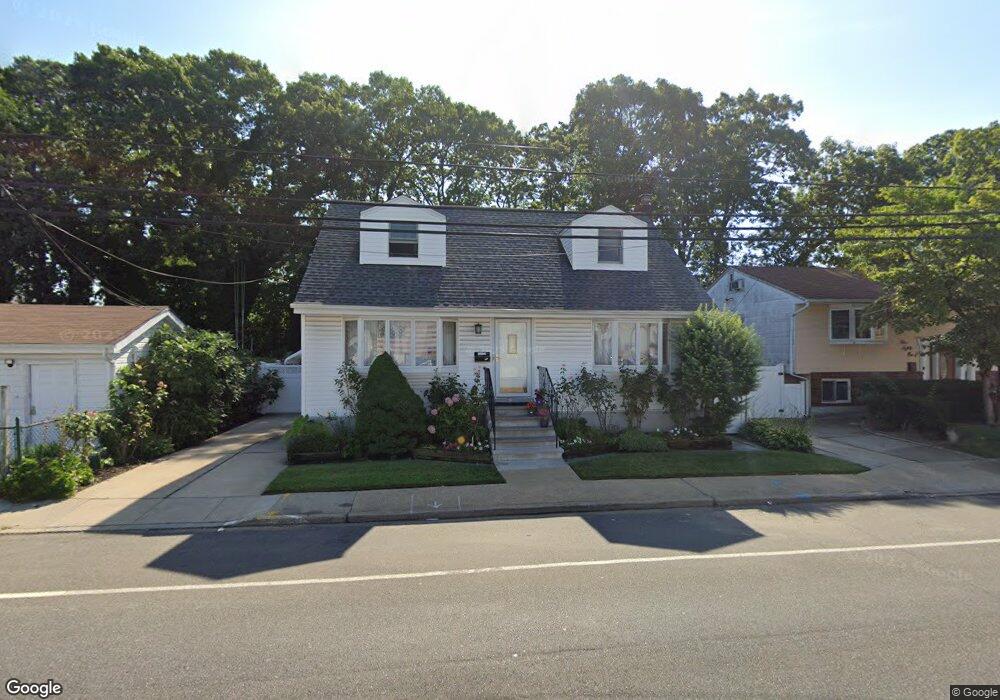
575 Meacham Ave Elmont, NY 11003
Estimated Value: $733,752 - $759,000
--
Bed
3
Baths
1,488
Sq Ft
$502/Sq Ft
Est. Value
About This Home
This home is located at 575 Meacham Ave, Elmont, NY 11003 and is currently estimated at $746,376, approximately $501 per square foot. 575 Meacham Ave is a home located in Nassau County with nearby schools including Cheder at the Ohel.
Ownership History
Date
Name
Owned For
Owner Type
Purchase Details
Closed on
Mar 3, 2021
Sold by
Datta Ashok K and Datta Arun
Bought by
Vasquez Carlos and Cuervo Alexandra
Current Estimated Value
Home Financials for this Owner
Home Financials are based on the most recent Mortgage that was taken out on this home.
Original Mortgage
$434,000
Interest Rate
3%
Mortgage Type
New Conventional
Purchase Details
Closed on
Oct 15, 2008
Sold by
Joseph Geneva and Joseph Geneva Helen
Bought by
Geneva Anthony and Geneva Family Irrevocable Trus
Create a Home Valuation Report for This Property
The Home Valuation Report is an in-depth analysis detailing your home's value as well as a comparison with similar homes in the area
Home Values in the Area
Average Home Value in this Area
Purchase History
| Date | Buyer | Sale Price | Title Company |
|---|---|---|---|
| Vasquez Carlos | $542,500 | Wfg National Title | |
| Geneva Anthony | -- | None Available |
Source: Public Records
Mortgage History
| Date | Status | Borrower | Loan Amount |
|---|---|---|---|
| Previous Owner | Vasquez Carlos | $434,000 |
Source: Public Records
Tax History Compared to Growth
Tax History
| Year | Tax Paid | Tax Assessment Tax Assessment Total Assessment is a certain percentage of the fair market value that is determined by local assessors to be the total taxable value of land and additions on the property. | Land | Improvement |
|---|---|---|---|---|
| 2025 | $9,869 | $431 | $154 | $277 |
| 2024 | $3,555 | $432 | $154 | $278 |
| 2023 | $8,025 | $443 | $158 | $285 |
| 2022 | $8,025 | $443 | $158 | $285 |
| 2021 | $9,447 | $430 | $153 | $277 |
| 2020 | $6,341 | $406 | $323 | $83 |
| 2019 | $5,767 | $435 | $324 | $111 |
| 2018 | $5,859 | $464 | $0 | $0 |
| 2017 | $3,570 | $493 | $327 | $166 |
| 2016 | $6,092 | $522 | $311 | $211 |
| 2015 | $2,623 | $551 | $293 | $258 |
| 2014 | $2,623 | $551 | $293 | $258 |
| 2013 | $2,589 | $580 | $308 | $272 |
Source: Public Records
Map
Nearby Homes