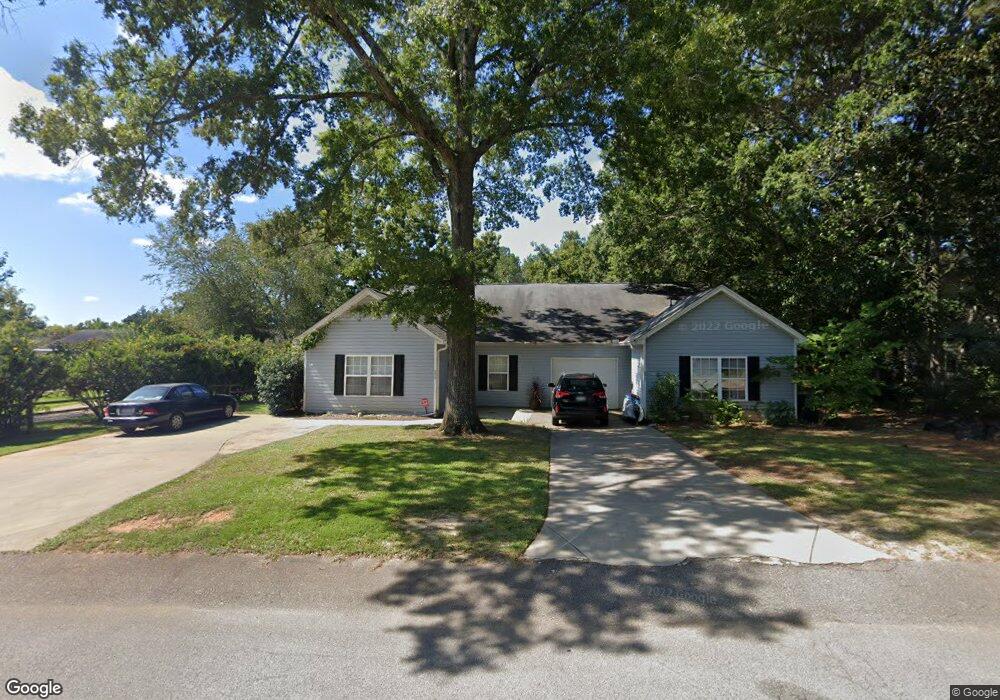
575 Old Bush River Rd Chapin, SC 29036
Estimated Value: $200,000 - $233,000
3
Beds
2
Baths
1,512
Sq Ft
$146/Sq Ft
Est. Value
About This Home
This home is located at 575 Old Bush River Rd, Chapin, SC 29036 and is currently estimated at $220,434, approximately $145 per square foot. 575 Old Bush River Rd is a home located in Lexington County with nearby schools including Lake Murray Elementary School, Chapin Intermediate, and Chapin High School.
Ownership History
Date
Name
Owned For
Owner Type
Purchase Details
Closed on
Jun 16, 2017
Sold by
Thompson Courtney J
Bought by
Brainard Jonathan E
Current Estimated Value
Home Financials for this Owner
Home Financials are based on the most recent Mortgage that was taken out on this home.
Original Mortgage
$99,170
Outstanding Balance
$81,569
Interest Rate
3.62%
Mortgage Type
FHA
Estimated Equity
$138,865
Purchase Details
Closed on
Sep 25, 2015
Sold by
Windsong Builders Llc
Bought by
Thompson Courtney J
Home Financials for this Owner
Home Financials are based on the most recent Mortgage that was taken out on this home.
Original Mortgage
$90,816
Interest Rate
3.97%
Mortgage Type
FHA
Purchase Details
Closed on
May 24, 2007
Sold by
Riverstone Properties Llc
Bought by
Windsong Builders Llc
Purchase Details
Closed on
Apr 20, 2007
Sold by
Paul Thiel Enterprises Inc
Bought by
Riverstone Properties Llc
Create a Home Valuation Report for This Property
The Home Valuation Report is an in-depth analysis detailing your home's value as well as a comparison with similar homes in the area
Home Values in the Area
Average Home Value in this Area
Purchase History
| Date | Buyer | Sale Price | Title Company |
|---|---|---|---|
| Brainard Jonathan E | $101,000 | None Available | |
| Thompson Courtney J | $37,653 | -- | |
| Windsong Builders Llc | $90,000 | None Available | |
| Riverstone Properties Llc | -- | None Available |
Source: Public Records
Mortgage History
| Date | Status | Borrower | Loan Amount |
|---|---|---|---|
| Open | Brainard Jonathan E | $99,170 | |
| Previous Owner | Thompson Courtney J | $90,816 |
Source: Public Records
Tax History Compared to Growth
Tax History
| Year | Tax Paid | Tax Assessment Tax Assessment Total Assessment is a certain percentage of the fair market value that is determined by local assessors to be the total taxable value of land and additions on the property. | Land | Improvement |
|---|---|---|---|---|
| 2024 | $765 | $4,646 | $798 | $3,848 |
| 2023 | $712 | $4,646 | $798 | $3,848 |
| 2022 | $718 | $4,646 | $798 | $3,848 |
| 2020 | $752 | $4,646 | $798 | $3,848 |
| 2019 | $664 | $4,040 | $420 | $3,620 |
| 2018 | $585 | $4,040 | $420 | $3,620 |
| 2017 | $502 | $3,560 | $420 | $3,140 |
| 2016 | $515 | $3,560 | $420 | $3,140 |
| 2014 | $618 | $4,289 | $560 | $3,729 |
| 2013 | -- | $4,290 | $560 | $3,730 |
Source: Public Records
Map
Nearby Homes
- 153 Rushton Dr
- 1533 Saugus Ct
- 129 Monroe Preserve Dr
- 228 Bickley View Ct
- 0 Mainsail Ln Unit 622256
- 147 Stuck's Point
- 814 Dutchmaster Dr
- 1431 Saugus Ct
- 357 Chapin Place Way
- 720 Topline St
- 358 Chapin Place Way
- 354 Chapin Place Way
- 342 Chapin Place Way
- 338 Chapin Place Way
- 330 Chapin Place Way
- 326 Chapin Place Way
- 0 Dreher Island Rd Unit 21647709
- 0 Dreher Island Rd Unit 587193
- 366 Gallery Cliff Dr
- 117 Bay Front Dr
- 571 Old Bush River Rd
- 577 Old Bush River Rd
- 567 Old Bush River Rd
- 579 Old Bush River Rd
- 579 Old Bush River Rd Unit 21B-1
- 581 Old Bush River Rd
- 581 Old Bush River Rd Unit 21B2
- 108 Owl Trace Ln
- 104 Owl Trace Ln
- 112 Owl Trace Ln
- 100 Owl Trace Ln
- 116 Owl Trace Ln
- 574 Old Bush River Rd
- 120 Owl Trace Ln
- 572 Old Bush River Rd Unit B
- 572 Old Bush River Rd
- 124 Owl Trace Ln
- 127 Owl Trace Ln
- 109 Owl Trace Ln
- 105 Owl Trace Ln