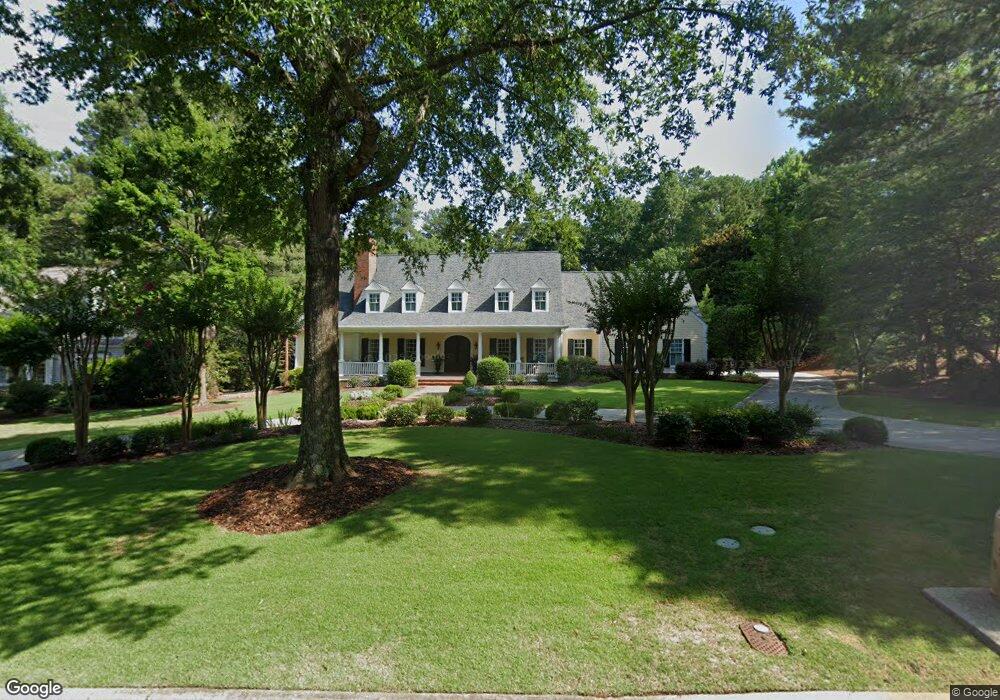
575 Old Cobblestone Dr Atlanta, GA 30350
Dunwoody Panhandle NeighborhoodEstimated Value: $1,246,474 - $2,081,000
5
Beds
4
Baths
5,169
Sq Ft
$320/Sq Ft
Est. Value
About This Home
This home is located at 575 Old Cobblestone Dr, Atlanta, GA 30350 and is currently estimated at $1,651,619, approximately $319 per square foot. 575 Old Cobblestone Dr is a home located in Fulton County with nearby schools including Dunwoody Springs Elementary School, Sandy Springs Middle School, and North Springs High School.
Ownership History
Date
Name
Owned For
Owner Type
Purchase Details
Closed on
Dec 28, 2020
Sold by
Loftis Rebecca S
Bought by
Loftis Rebecca S and Loftis Thomas E
Current Estimated Value
Home Financials for this Owner
Home Financials are based on the most recent Mortgage that was taken out on this home.
Original Mortgage
$272,000
Outstanding Balance
$242,718
Interest Rate
2.7%
Mortgage Type
New Conventional
Estimated Equity
$1,408,901
Purchase Details
Closed on
Feb 8, 2017
Sold by
Loftis Thomas E
Bought by
Loftis Rebecca S
Purchase Details
Closed on
Oct 31, 2012
Sold by
Loftis Rebecca S
Bought by
Loftis Thomas E and Loftis Rebecca S
Purchase Details
Closed on
Aug 15, 2008
Sold by
Loftis Thomas E
Bought by
Loftis Rebecca S
Purchase Details
Closed on
Jun 11, 1993
Sold by
Grant Bill Inc
Bought by
Loftis Thomas E Rebecca S
Home Financials for this Owner
Home Financials are based on the most recent Mortgage that was taken out on this home.
Original Mortgage
$330,000
Interest Rate
7.44%
Mortgage Type
Construction
Create a Home Valuation Report for This Property
The Home Valuation Report is an in-depth analysis detailing your home's value as well as a comparison with similar homes in the area
Home Values in the Area
Average Home Value in this Area
Purchase History
| Date | Buyer | Sale Price | Title Company |
|---|---|---|---|
| Loftis Rebecca S | -- | -- | |
| Loftis Rebecca S | -- | -- | |
| Loftis Thomas E | -- | -- | |
| Loftis Rebecca S | -- | -- | |
| Loftis Thomas E Rebecca S | $215,000 | -- |
Source: Public Records
Mortgage History
| Date | Status | Borrower | Loan Amount |
|---|---|---|---|
| Open | Loftis Rebecca S | $272,000 | |
| Previous Owner | Loftis Thomas E Rebecca S | $330,000 |
Source: Public Records
Tax History Compared to Growth
Tax History
| Year | Tax Paid | Tax Assessment Tax Assessment Total Assessment is a certain percentage of the fair market value that is determined by local assessors to be the total taxable value of land and additions on the property. | Land | Improvement |
|---|---|---|---|---|
| 2025 | $9,879 | $437,440 | $183,080 | $254,360 |
| 2023 | $9,512 | $337,000 | $160,000 | $177,000 |
| 2022 | $10,461 | $337,000 | $160,000 | $177,000 |
| 2021 | $8,452 | $386,280 | $196,160 | $190,120 |
| 2020 | $8,628 | $265,280 | $55,160 | $210,120 |
| 2019 | $8,506 | $260,560 | $54,160 | $206,400 |
| 2018 | $8,387 | $254,480 | $52,920 | $201,560 |
| 2017 | $7,877 | $244,680 | $50,880 | $193,800 |
| 2016 | $7,877 | $244,680 | $50,880 | $193,800 |
| 2015 | $7,904 | $244,680 | $50,880 | $193,800 |
| 2014 | $8,196 | $244,680 | $50,880 | $193,800 |
Source: Public Records
Map
Nearby Homes
- 535 Old Cobblestone Dr
- 530 Old Cobblestone Dr
- 8075 Habersham Waters Rd Unit 2
- 8085 Habersham Waters Rd
- 7565 Ball Mill Rd
- 575 Valley Hall Dr
- 7590 Chaparral Dr
- 2660 Spalding Dr
- 2615 Spalding Dr
- 7570 Chaparral Dr
- 1792 Ball Mill Ct
- 7410 Chestwick Ct
- 760 River Gate Dr
- 4101 Dunwoody Club Dr Unit 49
- 1959 Clairborne Ct
- 1960 Clairborne Ct
- 7465 Stoneykirk Close
- 1490 Chevron Dr
- 565 Old Cobblestone Dr
- 0 Old Cobblestone Dr Unit 3255138
- 0 Old Cobblestone Dr Unit 7429920
- 0 Old Cobblestone Dr Unit 8869755
- 630/40 Old Cobblestone Dr
- 0 Old Cobblestone Dr
- 555 Old Cobblestone Dr
- 1899 Old Dominion Dr Unit 3
- 560 Old Cobblestone Dr
- 1913 Old Dominion Dr Unit 3
- 580 Old Cobblestone Dr
- 1879 Old Dominion Dr
- 1865 Old Dominion Dr NE
- 545 Old Cobblestone Dr
- 1865 Old Dominion Dr
- 1927 Old Dominion Dr
- 0 Old Dominion Dr NE Unit 8844543
- 0 Old Dominion Dr NE Unit 8751681
- 0 Old Dominion Dr NE Unit 8680908
- 0 Old Dominion Dr NE Unit 8596760