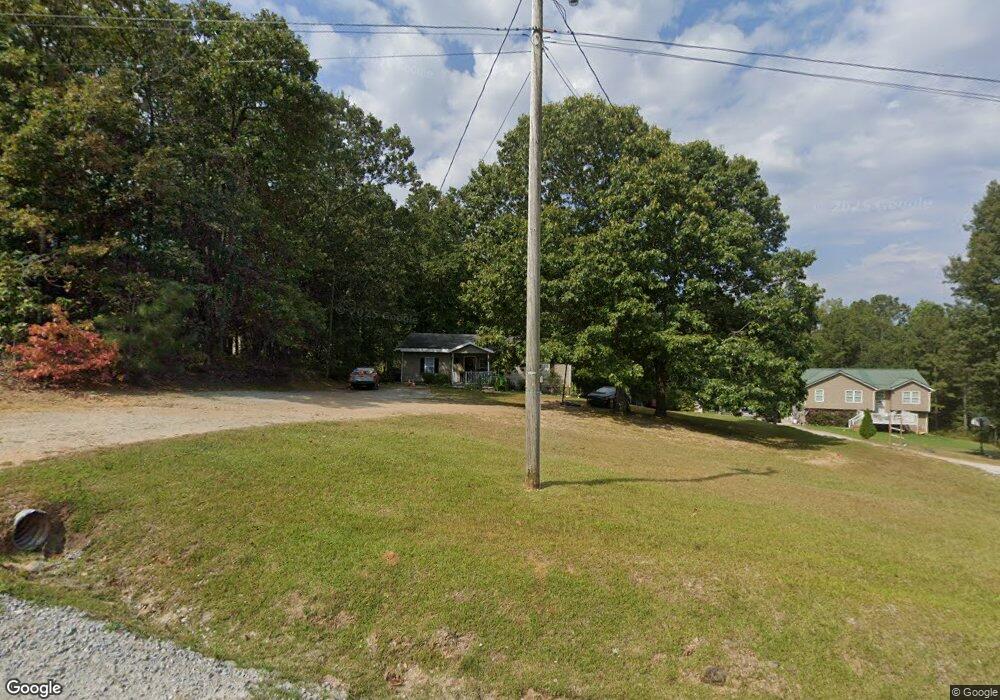
575 Reid St Roopville, GA 30170
Estimated Value: $220,018 - $284,000
3
Beds
1
Bath
1,175
Sq Ft
$205/Sq Ft
Est. Value
About This Home
This home is located at 575 Reid St, Roopville, GA 30170 and is currently estimated at $241,005, approximately $205 per square foot. 575 Reid St is a home located in Carroll County with nearby schools including Roopville Elementary School, Central Middle School, and Central High School.
Ownership History
Date
Name
Owned For
Owner Type
Purchase Details
Closed on
Nov 25, 2009
Sold by
Secretary Of Hud
Bought by
Reeves Richard
Current Estimated Value
Purchase Details
Closed on
Apr 1, 2008
Sold by
First Horizon Home Loans
Bought by
Sec Department Of Housin
Purchase Details
Closed on
Aug 2, 2002
Sold by
Coverson Raymond L
Bought by
Smith Christopher J
Purchase Details
Closed on
Sep 21, 2000
Sold by
Lynch Randall J
Bought by
Coverson Raymond L
Purchase Details
Closed on
Jun 20, 2000
Sold by
White Rosa L
Bought by
Lynch Randall J
Purchase Details
Closed on
Sep 6, 1995
Sold by
Polk Jimmy B
Bought by
Lynch Randall J
Purchase Details
Closed on
May 2, 1995
Sold by
Smith
Bought by
Polk Jimmy B
Purchase Details
Closed on
Sep 14, 1993
Bought by
Smith
Create a Home Valuation Report for This Property
The Home Valuation Report is an in-depth analysis detailing your home's value as well as a comparison with similar homes in the area
Home Values in the Area
Average Home Value in this Area
Purchase History
| Date | Buyer | Sale Price | Title Company |
|---|---|---|---|
| Reeves Richard | $12,000 | -- | |
| Sec Department Of Housin | $74,707 | -- | |
| First Horizon Home Loans | $74,707 | -- | |
| Smith Christopher J | $73,000 | -- | |
| Coverson Raymond L | $19,900 | -- | |
| Lynch Randall J | -- | -- | |
| Lynch Randall J | $15,000 | -- | |
| Polk Jimmy B | $15,000 | -- | |
| Smith | $15,000 | -- |
Source: Public Records
Tax History Compared to Growth
Tax History
| Year | Tax Paid | Tax Assessment Tax Assessment Total Assessment is a certain percentage of the fair market value that is determined by local assessors to be the total taxable value of land and additions on the property. | Land | Improvement |
|---|---|---|---|---|
| 2024 | $1,441 | $63,696 | $12,152 | $51,544 |
| 2023 | $1,441 | $56,609 | $9,722 | $46,887 |
| 2022 | $1,092 | $43,529 | $6,481 | $37,048 |
| 2021 | $946 | $36,894 | $5,185 | $31,709 |
| 2020 | $848 | $33,054 | $4,714 | $28,340 |
| 2019 | $782 | $30,208 | $4,714 | $25,494 |
| 2018 | $638 | $24,311 | $2,589 | $21,722 |
| 2017 | $640 | $24,311 | $2,589 | $21,722 |
| 2016 | $641 | $24,311 | $2,589 | $21,722 |
| 2015 | $780 | $27,903 | $4,433 | $23,471 |
| 2014 | $784 | $27,904 | $4,433 | $23,471 |
Source: Public Records
Map
Nearby Homes
- 0 Roopville Veal Rd Unit 10610800
- 0 Roopville Veal Rd Unit 120 148246
- 1949 Roopville Veal Rd
- 1949 Roopville Veal Rd Unit 11
- 67 Glenloch Rd
- 558 Craven Rd
- 305 West Dr
- 534 Craven Rd
- 534 Craven Rd Unit 137
- 537 Craven Rd
- 0 W Highway 5 Unit 10519663
- 0 Needmore Road- (345 37 Acres)
- 301 E Highway 5
- 335 Gum Creek Rd
- 0 Needmore Rd Unit (345.37 ACRES)
- 1358 W 5 Hwy
- 1360 Gum Creek Airport Rd
- 0 Huff Rd Unit TRACT 1
- 0 Huff Rd Unit TRACT 2
- 0 Needmore Rd Unit (345 37 Acres)
- 55 Spearman Rd
- 565 Reid St
- 0 Spearman Rd
- 0 Spearman Rd Unit 7129349
- 0 Spearman Rd Unit 9013614
- 0 Spearman Rd Unit 12+ - 8210593
- 0 Spearman Rd Unit 24 + - Acre 8309968
- 0 Spearman Rd Unit 8484993
- 0 Spearman Rd Unit 8700353
- 531 Reid St
- 311 Roopville Veal Rd
- 539 Reid St
- 529 Reid St
- 115 Spearman Rd
- 261 Roopville Veal Rd
- 370 Roopville Veal Rd
- 163 Spearman Rd
- 256 Roopville Veal Rd
- 437 Reid St
- 138 Spearman Rd