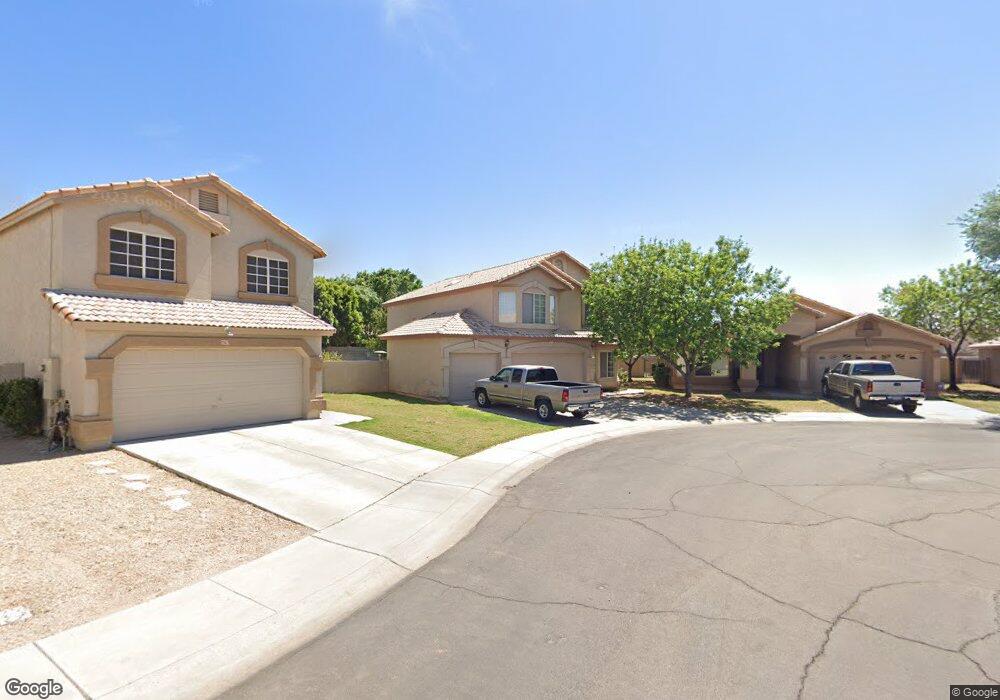
575 S Apache Dr Chandler, AZ 85224
Central Ridge NeighborhoodEstimated Value: $538,416 - $588,000
4
Beds
3
Baths
2,219
Sq Ft
$256/Sq Ft
Est. Value
About This Home
This home is located at 575 S Apache Dr, Chandler, AZ 85224 and is currently estimated at $568,104, approximately $256 per square foot. 575 S Apache Dr is a home located in Maricopa County with nearby schools including Conley Elementary School, Andersen Junior High School, and Hamilton High School.
Ownership History
Date
Name
Owned For
Owner Type
Purchase Details
Closed on
Oct 20, 2003
Sold by
Federal National Mortgage Association
Bought by
Barba Ismael G and Barba Martina M
Current Estimated Value
Purchase Details
Closed on
Jul 22, 2003
Sold by
Wasson Gordon M and Wasson Loretta
Bought by
Federal National Mortgage Association
Purchase Details
Closed on
Jul 16, 2002
Sold by
Wasson Gordon M
Bought by
Wasson Linda Loretta
Purchase Details
Closed on
Aug 6, 1999
Sold by
Speer Roger Lawrence and Rupert Speer Teresa Ann
Bought by
Wasson Gordon M and Wasson Loretta
Home Financials for this Owner
Home Financials are based on the most recent Mortgage that was taken out on this home.
Original Mortgage
$151,500
Interest Rate
7.56%
Mortgage Type
New Conventional
Create a Home Valuation Report for This Property
The Home Valuation Report is an in-depth analysis detailing your home's value as well as a comparison with similar homes in the area
Home Values in the Area
Average Home Value in this Area
Purchase History
| Date | Buyer | Sale Price | Title Company |
|---|---|---|---|
| Barba Ismael G | -- | Lawyers Title Of Arizona Inc | |
| Federal National Mortgage Association | $129,441 | -- | |
| Wasson Linda Loretta | -- | -- | |
| Wasson Gordon M | $159,500 | Capital Title Agency Inc |
Source: Public Records
Mortgage History
| Date | Status | Borrower | Loan Amount |
|---|---|---|---|
| Previous Owner | Wasson Gordon M | $151,500 |
Source: Public Records
Tax History
| Year | Tax Paid | Tax Assessment Tax Assessment Total Assessment is a certain percentage of the fair market value that is determined by local assessors to be the total taxable value of land and additions on the property. | Land | Improvement |
|---|---|---|---|---|
| 2025 | $1,389 | $17,827 | -- | -- |
| 2024 | $1,408 | -- | -- | -- |
| 2023 | $1,408 | $20,860 | $4,170 | $16,690 |
| 2022 | $1,427 | $20,860 | $4,170 | $16,690 |
| 2021 | $1,570 | $29,520 | $5,900 | $23,620 |
| 2020 | $1,641 | $27,830 | $5,560 | $22,270 |
| 2019 | $1,573 | $26,660 | $5,330 | $21,330 |
| 2018 | $1,320 | $20,860 | $4,170 | $16,690 |
| 2017 | $1,278 | $20,860 | $4,170 | $16,690 |
| 2016 | $1,290 | $23,560 | $4,710 | $18,850 |
| 2015 | $1,697 | $20,860 | $4,170 | $16,690 |
Source: Public Records
Map
Nearby Homes
- 1076 W Glenmere Dr
- 1283 W Morelos St
- 1052 W Morelos St
- 1340 W Elgin St
- 924 W Whitten St
- 1143 W Cindy St
- 1470 W Camino Ct
- 851 W Saragosa St
- 783 S Longmore St Unit 2
- 1200 W Chicago St
- 815 W Geronimo St
- 1395 W Browning Way
- 190 S Longmore St
- 1570 W Cindy St
- 868 S Brentwood Place
- 824 S Evergreen St
- 1631 W Cindy St
- 1601 W Butler Dr
- 1370 S Central Dr
- 758 W Winchester Dr
- 1203 W Glenmere Dr
- 563 S Apache Dr
- 620 S Chippewa Dr
- 640 S Chippewa Dr
- 600 S Chippewa Dr
- 551 S Apache Dr
- 1213 W Glenmere Dr
- 580 S Chippewa Dr
- 539 S Apache Dr
- 1223 W Glenmere Dr
- 560 S Chippewa Dr
- 1210 W Saragosa St
- 1220 W Saragosa St
- 1200 W Saragosa St
- 1230 W Saragosa St Unit 1
- 1190 W Saragosa St
- 527 S Apache Dr
- 1233 W Glenmere Dr
- 1222 W Glenmere Dr Unit 44
- 1222 W Glenmere Dr
Your Personal Tour Guide
Ask me questions while you tour the home.