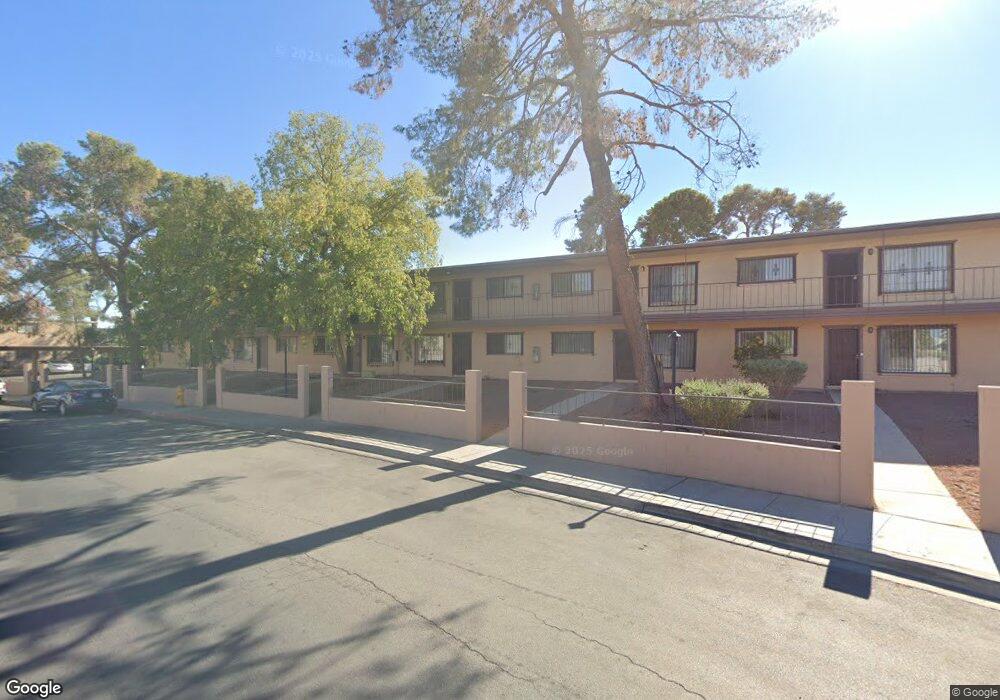
575 S Royal Crest Cir Unit 26 Las Vegas, NV 89169
University District NeighborhoodEstimated Value: $111,000 - $119,000
1
Bed
1
Bath
624
Sq Ft
$184/Sq Ft
Est. Value
About This Home
This home is located at 575 S Royal Crest Cir Unit 26, Las Vegas, NV 89169 and is currently estimated at $114,578, approximately $183 per square foot. 575 S Royal Crest Cir Unit 26 is a home located in Clark County with nearby schools including Dean Petersen Elementary School, William E. Orr Middle School, and Valley High School.
Ownership History
Date
Name
Owned For
Owner Type
Purchase Details
Closed on
Jun 13, 2023
Sold by
Wiener Benjamin A
Bought by
Ramirez Thomas Alexander Ma
Current Estimated Value
Home Financials for this Owner
Home Financials are based on the most recent Mortgage that was taken out on this home.
Original Mortgage
$110,483
Outstanding Balance
$107,529
Interest Rate
6.39%
Mortgage Type
New Conventional
Estimated Equity
$7,049
Purchase Details
Closed on
Jan 3, 2014
Sold by
The Secretary Of Hud
Bought by
Wiener Nation Benjamin A
Purchase Details
Closed on
Jun 13, 2013
Sold by
Midfirst Bank
Bought by
Secretary Of Hud
Purchase Details
Closed on
Feb 23, 1998
Sold by
Greene Samuel
Bought by
Nationsbanc Mtg Corp
Create a Home Valuation Report for This Property
The Home Valuation Report is an in-depth analysis detailing your home's value as well as a comparison with similar homes in the area
Home Values in the Area
Average Home Value in this Area
Purchase History
| Date | Buyer | Sale Price | Title Company |
|---|---|---|---|
| Ramirez Thomas Alexander Ma | $113,900 | Equity Title | |
| Wiener Benjamin A | -- | Equity Title | |
| Wiener Nation Benjamin A | $27,000 | Monument Title Insurance | |
| Secretary Of Hud | -- | Lsi Title Agency Inc | |
| Nationsbanc Mtg Corp | $37,851 | First American Title Co |
Source: Public Records
Mortgage History
| Date | Status | Borrower | Loan Amount |
|---|---|---|---|
| Open | Wiener Benjamin A | $110,483 |
Source: Public Records
Tax History Compared to Growth
Tax History
| Year | Tax Paid | Tax Assessment Tax Assessment Total Assessment is a certain percentage of the fair market value that is determined by local assessors to be the total taxable value of land and additions on the property. | Land | Improvement |
|---|---|---|---|---|
| 2025 | $421 | $14,653 | $8,470 | $6,183 |
| 2024 | $258 | $14,653 | $8,470 | $6,183 |
| 2023 | $258 | $17,753 | $12,320 | $5,433 |
| 2022 | $251 | $15,303 | $10,395 | $4,908 |
| 2021 | $232 | $14,277 | $9,625 | $4,652 |
| 2020 | $213 | $12,229 | $7,700 | $4,529 |
| 2019 | $200 | $11,331 | $6,930 | $4,401 |
| 2018 | $190 | $9,208 | $5,005 | $4,203 |
| 2017 | $248 | $8,440 | $4,235 | $4,205 |
| 2016 | $180 | $7,778 | $3,850 | $3,928 |
| 2015 | $178 | $6,408 | $2,695 | $3,713 |
| 2014 | $172 | $5,704 | $1,750 | $3,954 |
Source: Public Records
Map
Nearby Homes
- 585 S Royal Crest Cir Unit 13
- 565 S Royal Crest Cir Unit 19
- 3720 Royal Crest St Unit 16 & 17
- 3720 Royal Crest St Unit 6
- 555 S Royal Crest Cir Unit 2
- 595 S Royal Crest Cir Unit 20
- 605 S Royal Crest Cir Unit 8
- 605 S Royal Crest Cir Unit 9
- 605 S Royal Crest Cir Unit 20
- 730 S Royal Crest Cir Unit 426
- 730 S Royal Crest Cir Unit 421
- 3712 Royal Crest St Unit 14
- 615 S Royal Crest Cir Unit 8
- 615 S Royal Crest Cir Unit 10
- 3719 Hazelwood St Unit 16
- 625 S Royal Crest Cir Unit 2
- 625 S Royal Crest Cir Unit 23
- 750 S Royal Crest Cir Unit 353
- 750 S Royal Crest Cir Unit 316
- 3727 Hazelwood St Unit 12
- 575 S Royal Crest Cir
- 575 S Royal Crest Cir Unit 22
- 575 S Royal Crest Cir Unit 3
- 575 S Royal Crest Cir Unit 16
- 575 S Royal Crest Cir Unit 2
- 575 S Royal Crest Cir Unit 23
- 575 S Royal Crest Cir Unit 12
- 575 S Royal Crest Cir Unit 19
- 575 S Royal Crest Cir Unit 7
- 575 S Royal Crest Cir Unit 14
- 575 S Royal Crest Cir Unit 21
- 575 S Royal Crest Cir Unit 17
- 575 S Royal Crest Cir Unit 10
- 575 S Royal Crest Cir Unit 11
- 575 S Royal Crest Cir Unit 24
- 575 S Royal Crest Cir Unit 15
- 575 S Royal Crest Cir Unit 27
- 575 S Royal Crest Cir Unit 20
- 575 S Royal Crest Cir Unit 8