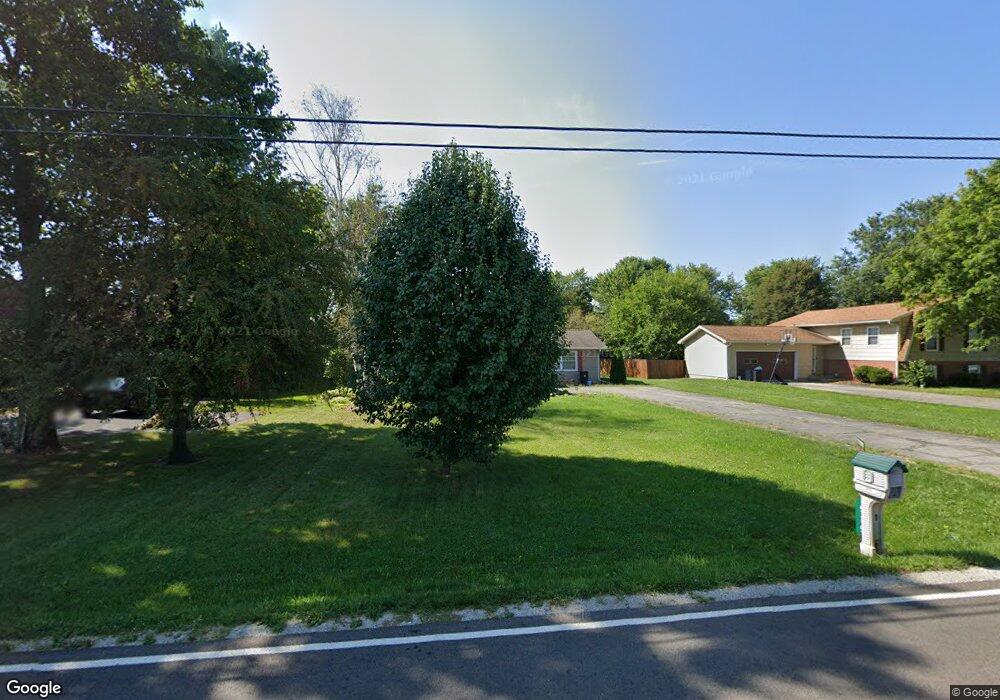
575 Somerlot Hoffman Rd E Marion, OH 43302
Estimated Value: $257,584 - $312,000
3
Beds
3
Baths
1,728
Sq Ft
$167/Sq Ft
Est. Value
About This Home
This home is located at 575 Somerlot Hoffman Rd E, Marion, OH 43302 and is currently estimated at $288,146, approximately $166 per square foot. 575 Somerlot Hoffman Rd E is a home located in Marion County with nearby schools including Pleasant Elementary School, Pleasant Middle School, and Pleasant High School.
Ownership History
Date
Name
Owned For
Owner Type
Purchase Details
Closed on
Jan 24, 2014
Sold by
Mcnamara Julie and Mcnamara Ian W
Bought by
Hawkins Jamie L and Hawkins Paul J
Current Estimated Value
Home Financials for this Owner
Home Financials are based on the most recent Mortgage that was taken out on this home.
Original Mortgage
$134,513
Interest Rate
4.62%
Mortgage Type
FHA
Purchase Details
Closed on
Oct 14, 2010
Sold by
Deutsche Bank National Trust Co
Bought by
Mcnamara Julie
Home Financials for this Owner
Home Financials are based on the most recent Mortgage that was taken out on this home.
Original Mortgage
$95,000
Interest Rate
4.31%
Mortgage Type
New Conventional
Purchase Details
Closed on
Aug 10, 2010
Sold by
Mild Cynthia S
Bought by
Deutsche Bank National Trust Co
Purchase Details
Closed on
Nov 18, 2004
Bought by
Hawkins Jamie L and Surv Paul J
Purchase Details
Closed on
Jun 28, 1996
Bought by
Hawkins Jamie L and Surv Paul J
Create a Home Valuation Report for This Property
The Home Valuation Report is an in-depth analysis detailing your home's value as well as a comparison with similar homes in the area
Purchase History
| Date | Buyer | Sale Price | Title Company |
|---|---|---|---|
| Hawkins Jamie L | $137,000 | Ct | |
| Mcnamara Julie | $100,000 | Fidelity National Title Ins | |
| Deutsche Bank National Trust Co | $83,334 | None Available | |
| Hawkins Jamie L | $165,000 | -- | |
| Hawkins Jamie L | $118,000 | -- |
Source: Public Records
Mortgage History
| Date | Status | Borrower | Loan Amount |
|---|---|---|---|
| Closed | Hawkins Jamie L | $134,513 | |
| Closed | Mcnamara Julie | $95,000 |
Source: Public Records
Tax History
| Year | Tax Paid | Tax Assessment Tax Assessment Total Assessment is a certain percentage of the fair market value that is determined by local assessors to be the total taxable value of land and additions on the property. | Land | Improvement |
|---|---|---|---|---|
| 2025 | $2,660 | $73,550 | $12,940 | $60,610 |
| 2024 | $2,660 | $64,510 | $11,230 | $53,280 |
| 2023 | $2,659 | $64,510 | $11,230 | $53,280 |
| 2022 | $2,657 | $64,510 | $11,230 | $53,280 |
| 2021 | $2,086 | $48,310 | $9,130 | $39,180 |
| 2020 | $2,060 | $48,310 | $9,130 | $39,180 |
| 2019 | $2,118 | $48,310 | $9,130 | $39,180 |
| 2018 | $1,484 | $45,110 | $8,000 | $37,110 |
| 2017 | $1,488 | $45,110 | $8,000 | $37,110 |
| 2016 | $1,485 | $45,110 | $8,000 | $37,110 |
| 2015 | $1,510 | $44,080 | $7,620 | $36,460 |
| 2014 | $1,511 | $44,080 | $7,620 | $36,460 |
| 2012 | $1,518 | $43,980 | $7,390 | $36,590 |
Source: Public Records
Map
Nearby Homes
- 2820 Scenic Rd
- 3068 Marion-Waldo Rd Unit 73
- 0 Owens Rd E
- 0 E Marion Cardington Rd Unit 9052845
- 0 E Marion Cardington Rd Unit 221031760
- 2531 Kreis Rd
- 1803 Richland Rd
- 1200 Inwood Dr
- 1545 Center Park Dr
- 1562 Center Park Dr
- 0 Republic Way Unit 225015738
- 1364 Woodridge Rd
- 1309 Lusch Rd
- 1639 Marion Waldo Rd Unit 70
- 1639 Marion Waldo Rd Unit 95
- 1639 Marion Waldo Rd Unit 113
- 3200 Smeltzer Rd Unit 92
- 3200 Smeltzer Rd Unit 53
- 3200 Smeltzer Rd Unit 22
- 1639 Marion-Waldo Rd Unit 1653
- 581 Somerlot Hoffman Rd E
- 553 Somerlot Hoffman Rd E
- 593 Somerlot Hoffman Rd E
- 537 Somerlot Hoffman Rd E
- 532 Gemini Dr
- 520 Gemini Dr
- 546 Gemini Dr
- 603 Somerlot Hoffman Rd E
- 586 Gemini Dr
- 506 Gemini Dr
- 498 Gemini Dr
- 622 Gemini Dr
- 2790 Neidhart Rd
- 2800 Neidhart Rd
- 595 Gemini Dr
- 573 Gemini Dr
- 531 Gemini Dr
- 545 Gemini Dr
- 561 Gemini Dr
- 505 Gemini Dr
Your Personal Tour Guide
Ask me questions while you tour the home.