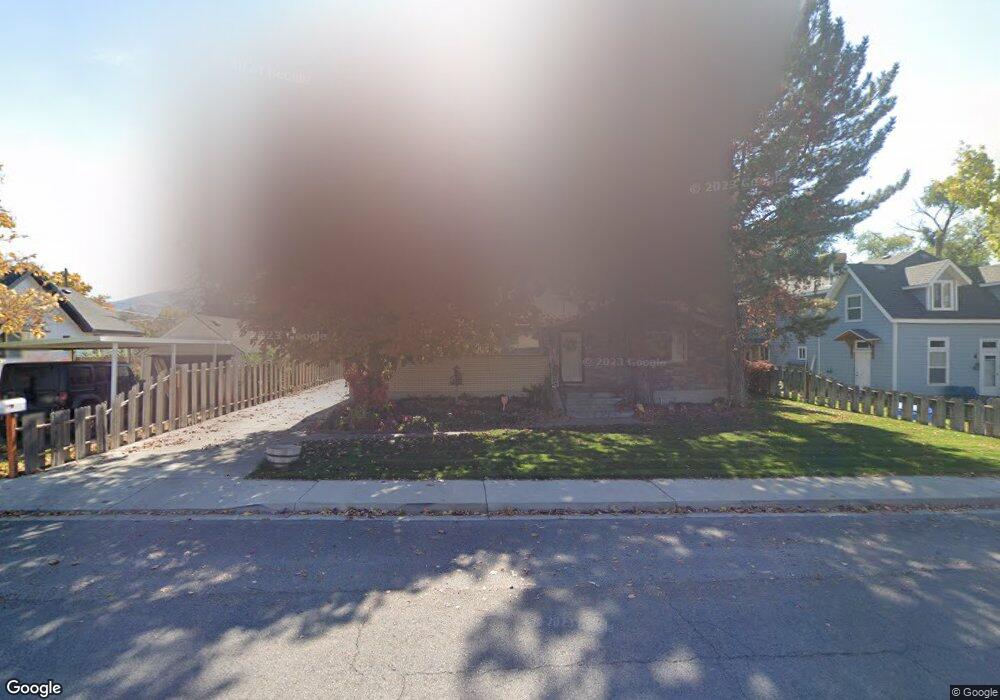
575 W 200 S Payson, UT 84651
Estimated Value: $449,000 - $522,699
3
Beds
2
Baths
1,323
Sq Ft
$362/Sq Ft
Est. Value
About This Home
This home is located at 575 W 200 S, Payson, UT 84651 and is currently estimated at $478,675, approximately $361 per square foot. 575 W 200 S is a home located in Utah County with nearby schools including Wilson Elementary School, Mt. Nebo Junior High School, and Mt. Nebo Middle.
Ownership History
Date
Name
Owned For
Owner Type
Purchase Details
Closed on
Jul 17, 2024
Sold by
Hancock Steve J and Hancock Steven J
Bought by
Hancock Steven J and Hancock Karen L
Current Estimated Value
Home Financials for this Owner
Home Financials are based on the most recent Mortgage that was taken out on this home.
Original Mortgage
$756,000
Outstanding Balance
$626,846
Interest Rate
6.7%
Mortgage Type
Reverse Mortgage Home Equity Conversion Mortgage
Estimated Equity
-$148,171
Purchase Details
Closed on
Sep 18, 2012
Sold by
Hancock Steven J and Hancock Karen L
Bought by
Hancock Steve J and Hancock Karen L
Home Financials for this Owner
Home Financials are based on the most recent Mortgage that was taken out on this home.
Original Mortgage
$133,000
Interest Rate
3.55%
Mortgage Type
New Conventional
Create a Home Valuation Report for This Property
The Home Valuation Report is an in-depth analysis detailing your home's value as well as a comparison with similar homes in the area
Home Values in the Area
Average Home Value in this Area
Purchase History
| Date | Buyer | Sale Price | Title Company |
|---|---|---|---|
| Hancock Steven J | -- | First American Title Insurance | |
| Hancock Steve J | -- | Title West |
Source: Public Records
Mortgage History
| Date | Status | Borrower | Loan Amount |
|---|---|---|---|
| Open | Hancock Steven J | $756,000 | |
| Closed | Hancock Steven J | $756,000 | |
| Previous Owner | Hancock Steve J | $133,000 |
Source: Public Records
Tax History Compared to Growth
Tax History
| Year | Tax Paid | Tax Assessment Tax Assessment Total Assessment is a certain percentage of the fair market value that is determined by local assessors to be the total taxable value of land and additions on the property. | Land | Improvement |
|---|---|---|---|---|
| 2025 | $2,299 | $252,835 | $123,300 | $336,400 |
| 2024 | $2,299 | $233,970 | $0 | $0 |
| 2023 | $2,130 | $217,415 | $0 | $0 |
| 2022 | $2,219 | $222,750 | $0 | $0 |
| 2021 | $1,839 | $296,000 | $90,600 | $205,400 |
| 2020 | $1,721 | $271,100 | $78,800 | $192,300 |
| 2019 | $1,613 | $260,400 | $68,100 | $192,300 |
| 2018 | $1,456 | $226,600 | $57,300 | $169,300 |
| 2017 | $1,330 | $111,320 | $0 | $0 |
| 2016 | $1,306 | $108,570 | $0 | $0 |
| 2015 | $1,183 | $97,735 | $0 | $0 |
| 2014 | $1,043 | $86,790 | $0 | $0 |
Source: Public Records
Map
Nearby Homes
- 219 S Majestic W
- 533 S 700 W
- 528 S 800 W
- 513 W 600 S
- 610 S 800 W Unit 30
- 626 S 800 W Unit 32
- 527 S 1000 W
- 1836 S 100 E Unit 2
- 116 E 100 S
- 135 E 500 S
- 84 W 400 N
- 115 N 300 E
- 252 S 400 E
- 370 E 300 S
- 244 E 300 N
- 1323 N 1390 E Unit 26-101
- 1287 N 1390 E Unit 25-96
- 383 W 625 N Unit A-D
- 384 W 650 N Unit A-D
- 387 N 300 E