Estimated Value: $582,000 - $609,000
3
Beds
3
Baths
1,433
Sq Ft
$416/Sq Ft
Est. Value
About This Home
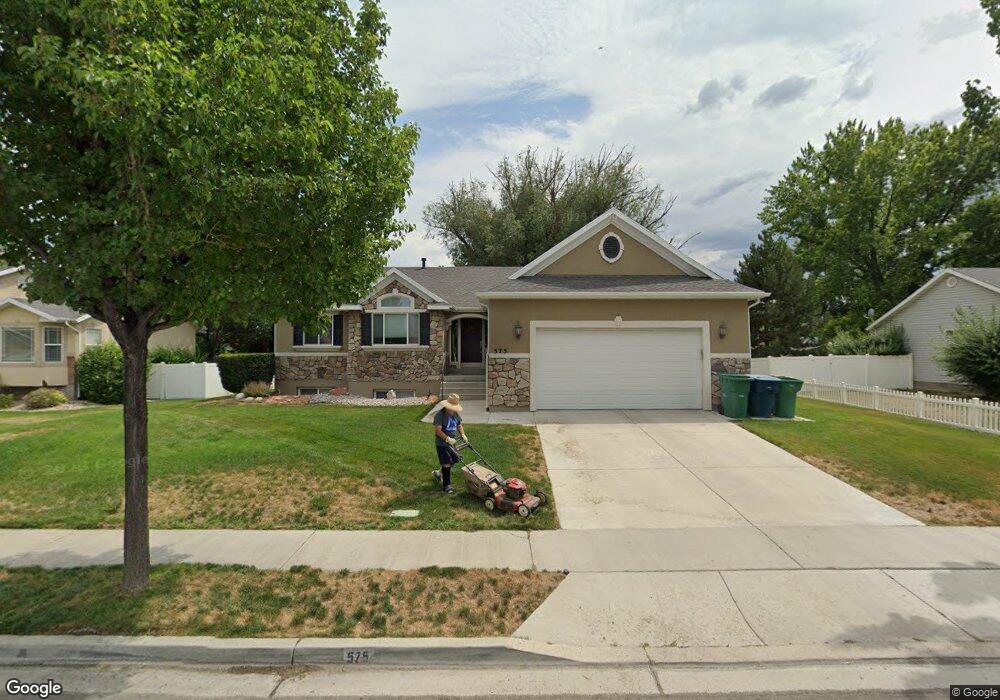
This home is located at 575 W 975 S Unit 338, Lehi, UT 84043 and is currently estimated at $595,612, approximately $415 per square foot. 575 W 975 S Unit 338 is a home located in Utah County with nearby schools including Meadow Elementary School, Lehi Junior High School, and Lehi High School.
Ownership History
Date
Name
Owned For
Owner Type
Purchase Details
Closed on
Sep 20, 2007
Sold by
Swenson Devon M and Swenson Michaun D
Bought by
Zentner Robert L and Zentner Vyonne
Current Estimated Value
Home Financials for this Owner
Home Financials are based on the most recent Mortgage that was taken out on this home.
Original Mortgage
$240,400
Outstanding Balance
$151,344
Interest Rate
6.46%
Mortgage Type
Purchase Money Mortgage
Estimated Equity
$444,268
Purchase Details
Closed on
Jun 17, 2005
Sold by
Schaffer Robbin L
Bought by
Swenson Devon M and Swenson Michaun D
Home Financials for this Owner
Home Financials are based on the most recent Mortgage that was taken out on this home.
Original Mortgage
$180,000
Interest Rate
5.72%
Mortgage Type
Purchase Money Mortgage
Purchase Details
Closed on
May 3, 2004
Sold by
Greenbriar Inc Pc
Bought by
Schaffer Homes
Purchase Details
Closed on
Sep 4, 2001
Sold by
Patterson Construction Inc
Bought by
Greenbriar Inc Pc
Create a Home Valuation Report for This Property
The Home Valuation Report is an in-depth analysis detailing your home's value as well as a comparison with similar homes in the area
Home Values in the Area
Average Home Value in this Area
Purchase History
| Date | Buyer | Sale Price | Title Company |
|---|---|---|---|
| Zentner Robert L | -- | Backman | |
| Swenson Devon M | -- | Backman Title Services Ltd | |
| Schaffer Homes | -- | Title West Title Company | |
| Greenbriar Inc Pc | -- | Signature Title |
Source: Public Records
Mortgage History
| Date | Status | Borrower | Loan Amount |
|---|---|---|---|
| Open | Zentner Robert L | $240,400 | |
| Previous Owner | Swenson Devon M | $180,000 |
Source: Public Records
Tax History Compared to Growth
Tax History
| Year | Tax Paid | Tax Assessment Tax Assessment Total Assessment is a certain percentage of the fair market value that is determined by local assessors to be the total taxable value of land and additions on the property. | Land | Improvement |
|---|---|---|---|---|
| 2025 | $2,346 | $298,100 | $198,100 | $343,900 |
| 2024 | $2,346 | $274,560 | $0 | $0 |
| 2023 | $2,184 | $277,530 | $0 | $0 |
| 2022 | $2,323 | $286,110 | $0 | $0 |
| 2021 | $2,089 | $389,100 | $114,600 | $274,500 |
| 2020 | $1,970 | $362,600 | $106,100 | $256,500 |
| 2019 | $1,838 | $351,700 | $106,100 | $245,600 |
| 2018 | $1,768 | $319,900 | $91,900 | $228,000 |
| 2017 | $1,691 | $162,635 | $0 | $0 |
| 2016 | $1,757 | $156,805 | $0 | $0 |
| 2015 | $1,771 | $149,985 | $0 | $0 |
| 2014 | $1,780 | $149,930 | $0 | $0 |
Source: Public Records
Map
Nearby Homes
- 911 S Chappel Valley Loop
- 1812 N Lake Rd
- 743 S 560 W
- 652 S 500 W
- 772 W 700 S
- 672 S 780 W
- 736 S 300 W
- 798 S 925 W
- 453 S 230 W
- 285 S 660 W
- 1204 S 50 E Unit 1
- 669 S 1250 W
- 1012 W 425 S Unit 5
- 1012 W 425 S
- 1351 W 700 St S
- 1201 S 100 E Unit 1
- 817 S 1365 W
- Adagio Plan at Grandeur Estates
- Ballad Plan at Grandeur Estates
- Interlude Plan at Grandeur Estates