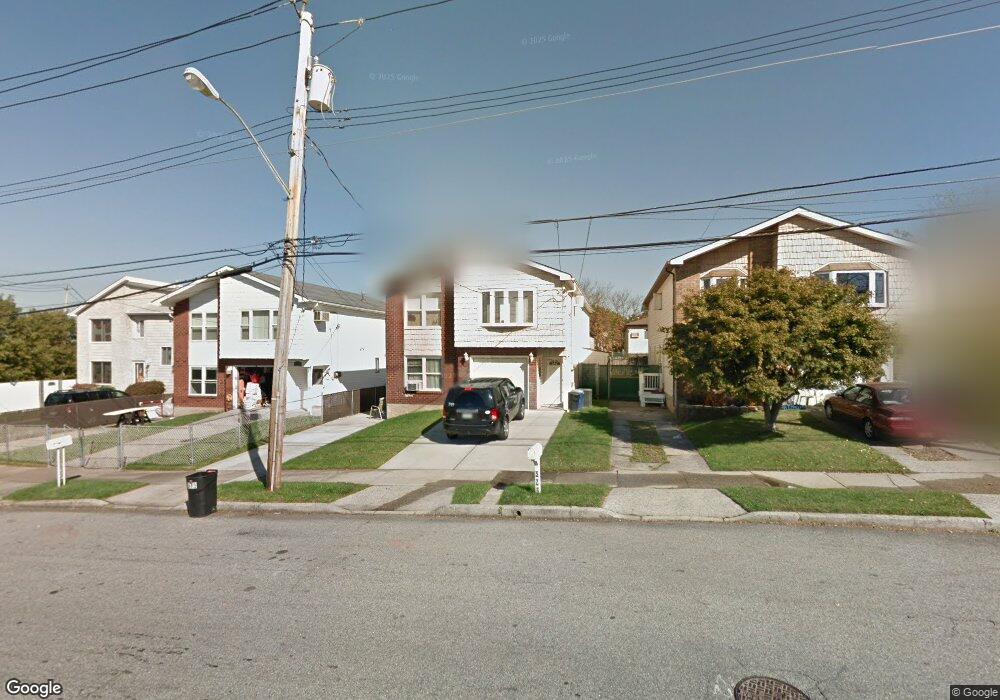
575 Winant Ave Staten Island, NY 10309
Rossville NeighborhoodEstimated Value: $846,943 - $1,103,000
3
Beds
2
Baths
2,584
Sq Ft
$377/Sq Ft
Est. Value
About This Home
This home is located at 575 Winant Ave, Staten Island, NY 10309 and is currently estimated at $974,736, approximately $377 per square foot. 575 Winant Ave is a home located in Richmond County with nearby schools including P.S. 56 - The Louis Desario School, Is 34 Tottenville, and Tottenville High School.
Ownership History
Date
Name
Owned For
Owner Type
Purchase Details
Closed on
Nov 24, 2009
Sold by
Bacas John E and Bacas Eva
Bought by
Scanni Joseph
Current Estimated Value
Purchase Details
Closed on
Aug 1, 2002
Sold by
Bacas John E and Phillips Maureen E
Bought by
Bacas John E and Bacas Eva
Purchase Details
Closed on
Dec 28, 2001
Sold by
Duffy John
Bought by
Bacas John E and Phillips Maureen E
Home Financials for this Owner
Home Financials are based on the most recent Mortgage that was taken out on this home.
Original Mortgage
$292,500
Interest Rate
7.08%
Mortgage Type
Purchase Money Mortgage
Purchase Details
Closed on
Jan 22, 2001
Sold by
Duffy Terrence and Duffy Karen A
Bought by
Duffy John
Home Financials for this Owner
Home Financials are based on the most recent Mortgage that was taken out on this home.
Original Mortgage
$87,436
Interest Rate
6.87%
Create a Home Valuation Report for This Property
The Home Valuation Report is an in-depth analysis detailing your home's value as well as a comparison with similar homes in the area
Home Values in the Area
Average Home Value in this Area
Purchase History
| Date | Buyer | Sale Price | Title Company |
|---|---|---|---|
| Scanni Joseph | $415,000 | Lawyers Title Insurance Corp | |
| Bacas John E | -- | Fidelity Natl Title Ins Co N | |
| Bacas John E | $377,500 | Fidelity National Title Ins | |
| Duffy John | $87,500 | -- |
Source: Public Records
Mortgage History
| Date | Status | Borrower | Loan Amount |
|---|---|---|---|
| Previous Owner | Bacas John E | $292,500 | |
| Previous Owner | Duffy John | $87,436 |
Source: Public Records
Tax History Compared to Growth
Tax History
| Year | Tax Paid | Tax Assessment Tax Assessment Total Assessment is a certain percentage of the fair market value that is determined by local assessors to be the total taxable value of land and additions on the property. | Land | Improvement |
|---|---|---|---|---|
| 2025 | $7,838 | $55,500 | $6,887 | $48,613 |
| 2024 | $7,838 | $45,360 | $7,949 | $37,411 |
| 2023 | $7,477 | $36,816 | $7,052 | $29,764 |
| 2022 | $6,934 | $48,000 | $9,240 | $38,760 |
| 2021 | $7,310 | $45,360 | $9,240 | $36,120 |
| 2020 | $7,389 | $43,260 | $9,240 | $34,020 |
| 2019 | $10,120 | $42,900 | $9,240 | $33,660 |
| 2018 | $6,254 | $30,680 | $7,633 | $23,047 |
| 2017 | $5,900 | $28,944 | $7,712 | $21,232 |
| 2016 | $5,786 | $28,944 | $7,903 | $21,041 |
| 2015 | $5,201 | $28,727 | $6,784 | $21,943 |
| 2014 | $5,201 | $27,101 | $7,658 | $19,443 |
Source: Public Records
Map
Nearby Homes
- 149 Lucille Ave
- 494 Winant Ave
- 125 Wirt Ave
- 97 Bower Ct Unit 1
- 97 Bower Ct Unit 74
- 37 Charleston Ave
- 76 Lucille Ave
- 159 Wirt Ave
- 39 Hemlock Ct Unit 152
- 22 Charleston Ave Unit 168
- 40 Bower Ct
- 16 Wirt Ln
- 857 Bloomingdale Rd
- 5 Wirt Ave
- 38 Cypress Loop
- 15 Lorraine Loop
- 87 Cypress Loop Unit 243
- 85 Cypress Loop
- 17 Lorraine Loop
- 45 Redwood Loop
- 571 Winant Ave
- 579 Winant Ave
- 567 Winant Ave
- 203 Westfield Ave
- 26 Kunath Ave
- 583 Winant Ave
- 30 Kunath Ave
- 22 Kunath Ave
- 34 Kunath Ave
- 18 Kunath Ave
- 14 Kunath Ave
- 0 Westfield Ave
- 8 Kunath Ave
- 73 Westfield Ave
- 209 Westfield Ave
- 77 Westfield Ave
- 69 Westfield Ave
- 65 Westfield Ave
- 61 Westfield Ave
- 556 Winant Ave