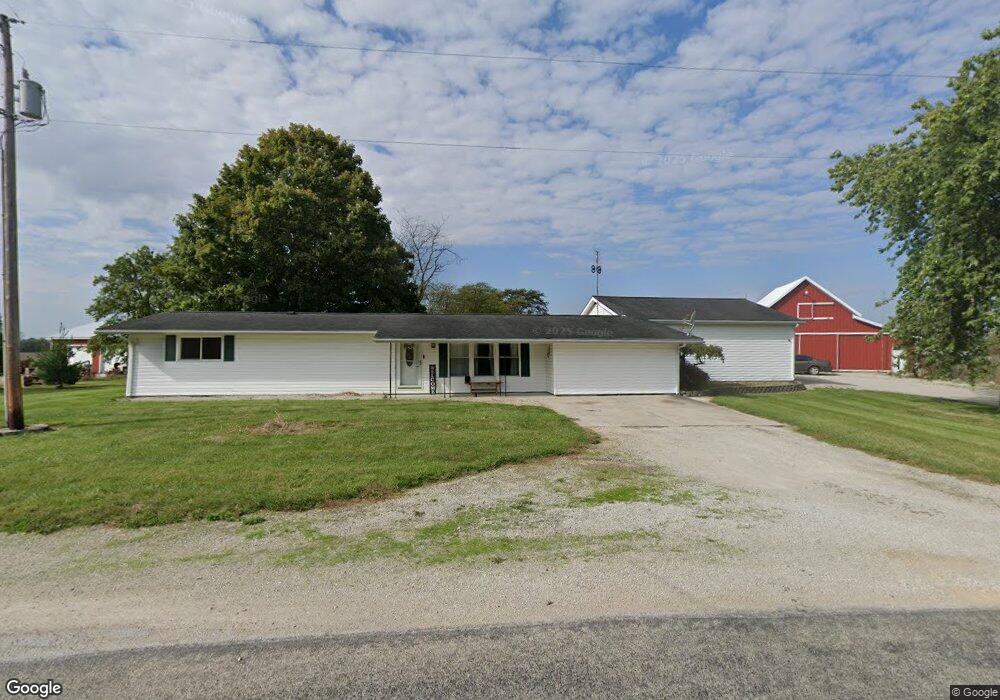
5750 E River Rd Montpelier, IN 47359
Estimated Value: $103,000 - $278,000
3
Beds
2
Baths
1,712
Sq Ft
$102/Sq Ft
Est. Value
About This Home
This home is located at 5750 E River Rd, Montpelier, IN 47359 and is currently estimated at $175,359, approximately $102 per square foot. 5750 E River Rd is a home located in Blackford County with nearby schools including Blackford Primary School, Southside Elementary School, and Blackford Junior-Senior High School.
Ownership History
Date
Name
Owned For
Owner Type
Purchase Details
Closed on
May 19, 2025
Sold by
Runkel Kendra
Bought by
Campbell Hailey J
Current Estimated Value
Purchase Details
Closed on
Nov 23, 2020
Sold by
White Diana Patrice and Bargerhyff Karen D
Bought by
Sargent Kendra
Home Financials for this Owner
Home Financials are based on the most recent Mortgage that was taken out on this home.
Original Mortgage
$91,575
Interest Rate
2.8%
Mortgage Type
FHA
Purchase Details
Closed on
Mar 4, 2008
Sold by
Avey Karen
Bought by
Avey Karen D and White Diana Patrice
Home Financials for this Owner
Home Financials are based on the most recent Mortgage that was taken out on this home.
Original Mortgage
$23,500
Interest Rate
5.75%
Mortgage Type
Purchase Money Mortgage
Purchase Details
Closed on
Jun 17, 2005
Sold by
Abel Ronald D and Abel Veda Diane
Bought by
Abel Veda Diane
Create a Home Valuation Report for This Property
The Home Valuation Report is an in-depth analysis detailing your home's value as well as a comparison with similar homes in the area
Purchase History
| Date | Buyer | Sale Price | Title Company |
|---|---|---|---|
| Campbell Hailey J | $100,000 | Near North Title Group | |
| Sargent Kendra | $100,000 | Forcum & Forbes Llp | |
| Avey Karen D | -- | None Available | |
| Avey Karen | -- | None Available | |
| Abel Veda Diane | -- | None Available |
Source: Public Records
Mortgage History
| Date | Status | Borrower | Loan Amount |
|---|---|---|---|
| Previous Owner | Sargent Kendra | $91,575 | |
| Previous Owner | Avey Karen D | $23,500 |
Source: Public Records
Tax History
| Year | Tax Paid | Tax Assessment Tax Assessment Total Assessment is a certain percentage of the fair market value that is determined by local assessors to be the total taxable value of land and additions on the property. | Land | Improvement |
|---|---|---|---|---|
| 2025 | $1,236 | $182,600 | $20,100 | $162,500 |
| 2024 | $1,236 | $146,400 | $20,100 | $126,300 |
| 2023 | $1,138 | $137,900 | $11,600 | $126,300 |
| 2022 | $962 | $111,900 | $11,600 | $100,300 |
| 2021 | $751 | $94,900 | $11,600 | $83,300 |
| 2020 | $579 | $85,300 | $11,600 | $73,700 |
| 2019 | $566 | $0 | $0 | $0 |
| 2018 | $594 | $88,600 | $11,600 | $77,000 |
| 2017 | $570 | $89,600 | $11,600 | $78,000 |
| 2016 | $538 | $87,400 | $11,600 | $75,800 |
| 2014 | $391 | $73,600 | $11,600 | $62,000 |
| 2013 | $391 | $73,400 | $11,600 | $61,800 |
Source: Public Records
Map
Nearby Homes
- 126 W Windsor St
- 332 S Main St
- Corner of 400 N & 700 Rd E
- 422 S Jefferson St
- 560 S Jefferson St
- 404 W Huntington St
- TBD W Windsor St
- 445 W Huntington St
- 510 W Henderson St
- 512 W Plate Glass St
- 10088 S Ohio St
- 9830 S 200 W
- 9814 S Cr 200 W
- 0 N 700 E Unit 202520586
- 0 County Road 300 N
- 6970 N 100 W
- 2141 N 100 E
- 8539 W 1000 S-90
- 4369 Indiana 26
- 4399 Indiana 26
- 5754 E River Rd
- 5751 E River Rd
- 5694 E State Road 18
- 5742 E State Road 18
- 5780 E State Road 18
- 5733 E State Road 18
- 5697 E State Road 18
- 5793 E State Road 18
- 6735 N Woodlawn Dr
- 5566 E State Road 18
- 5826 E River Rd
- 5579 E State Road 18
- 5579 E State Road 18 Unit 18
- 5534 E State Road 18
- 5579 E Sr 18
- 5571 E Sr 18
- 5510 E State Road 18
- 5571 E State Road 18
- 6008 E State Road 18
- 5981 E State Road 18
Your Personal Tour Guide
Ask me questions while you tour the home.