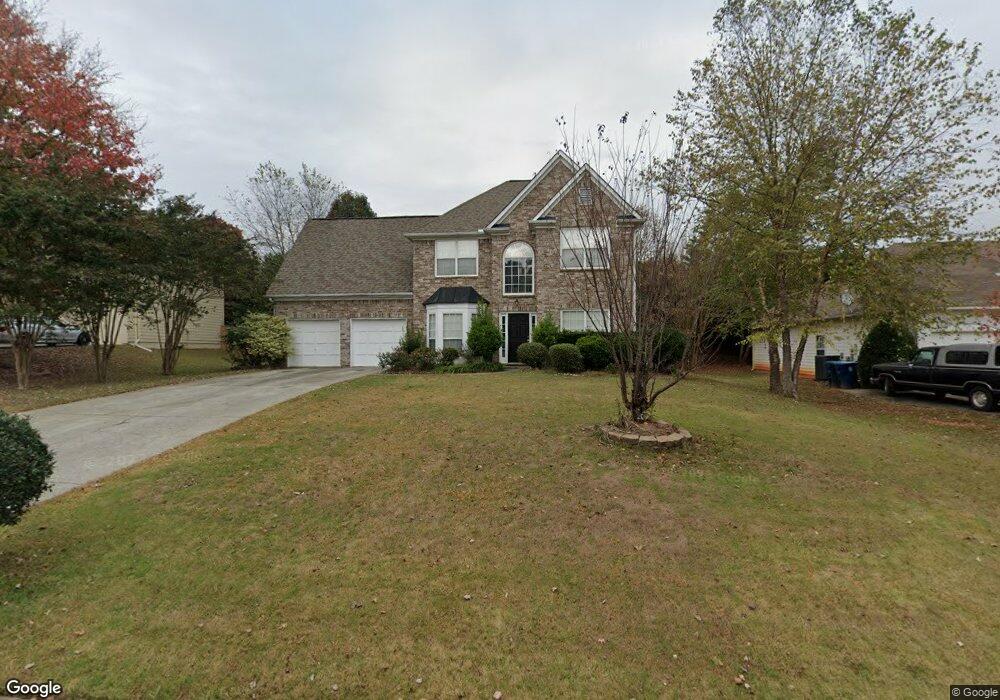
5750 Kennemore Dr Alpharetta, GA 30004
Estimated Value: $561,609 - $579,000
4
Beds
3
Baths
2,082
Sq Ft
$273/Sq Ft
Est. Value
About This Home
This home is located at 5750 Kennemore Dr, Alpharetta, GA 30004 and is currently estimated at $567,652, approximately $272 per square foot. 5750 Kennemore Dr is a home located in Forsyth County with nearby schools including Brandywine Elementary School, DeSana Middle School, and Denmark High School.
Ownership History
Date
Name
Owned For
Owner Type
Purchase Details
Closed on
Apr 5, 2008
Sold by
Espinoza Anabelle V
Bought by
Espinoza Ernesto and Espinoza Roselin B
Current Estimated Value
Home Financials for this Owner
Home Financials are based on the most recent Mortgage that was taken out on this home.
Original Mortgage
$200,000
Outstanding Balance
$127,088
Interest Rate
6.03%
Mortgage Type
New Conventional
Estimated Equity
$440,564
Purchase Details
Closed on
Mar 12, 2004
Sold by
Knight Thomas A and Knight Sherry E
Bought by
Espinoza Anabelle V and Espinoza Ernesto
Home Financials for this Owner
Home Financials are based on the most recent Mortgage that was taken out on this home.
Original Mortgage
$40,100
Interest Rate
5.72%
Mortgage Type
New Conventional
Purchase Details
Closed on
Jul 23, 1999
Sold by
Mccar Dev Corp
Bought by
Knight Thomas A and Knight Sherry E
Home Financials for this Owner
Home Financials are based on the most recent Mortgage that was taken out on this home.
Original Mortgage
$162,650
Interest Rate
7.66%
Mortgage Type
New Conventional
Create a Home Valuation Report for This Property
The Home Valuation Report is an in-depth analysis detailing your home's value as well as a comparison with similar homes in the area
Home Values in the Area
Average Home Value in this Area
Purchase History
| Date | Buyer | Sale Price | Title Company |
|---|---|---|---|
| Espinoza Ernesto | -- | -- | |
| Espinoza Anabelle V | $200,000 | -- | |
| Knight Thomas A | $171,300 | -- |
Source: Public Records
Mortgage History
| Date | Status | Borrower | Loan Amount |
|---|---|---|---|
| Open | Espinoza Ernesto | $200,000 | |
| Previous Owner | Espinoza Anabelle V | $40,100 | |
| Previous Owner | Knight Thomas A | $162,650 |
Source: Public Records
Tax History Compared to Growth
Tax History
| Year | Tax Paid | Tax Assessment Tax Assessment Total Assessment is a certain percentage of the fair market value that is determined by local assessors to be the total taxable value of land and additions on the property. | Land | Improvement |
|---|---|---|---|---|
| 2025 | $3,765 | $210,764 | $68,000 | $142,764 |
| 2024 | $3,765 | $193,124 | $68,000 | $125,124 |
| 2023 | $3,066 | $172,796 | $60,000 | $112,796 |
| 2022 | $3,247 | $120,440 | $40,000 | $80,440 |
| 2021 | $2,900 | $120,440 | $40,000 | $80,440 |
| 2020 | $2,777 | $114,500 | $30,000 | $84,500 |
| 2019 | $2,596 | $105,520 | $30,000 | $75,520 |
| 2018 | $2,493 | $99,940 | $30,000 | $69,940 |
| 2017 | $2,274 | $89,116 | $30,000 | $59,116 |
| 2016 | $2,148 | $83,116 | $24,000 | $59,116 |
| 2015 | $2,109 | $81,116 | $22,000 | $59,116 |
| 2014 | $1,862 | $74,096 | $0 | $0 |
Source: Public Records
Map
Nearby Homes
- 5750 Bryson Ln
- 5740 Bryson Ln
- 406 Weatherstone Place
- 5870 Shiloh Woods Dr
- 470 Montgomery Ave
- 130 Fowler Hill Rd
- 6130 Shiloh Woods Dr
- 5430 Breckinridge Ln
- 1650 Township Cir
- 1615 Waverly Glen Dr
- 1465 Queens Ln
- 1255 Faircrest Crossing Dr
- 1620 Woodall View Ct
- 1570 Winshire Cove
- 419 Grayson Way
- 368 Grayson Way
- 1405 Overland Crossing
- 5025 Montes Ln
- 255 White Pines Dr
- 915 Elmsbrook Ln
- 5740 Kennemore Dr
- 5760 Kennemore Dr Unit 24
- 5760 Kennemore Dr
- 5730 Kennemore Dr
- 5755 Kennemore Dr
- 5745 Kennemore Dr
- 5735 Kennemore Dr
- 5715 Rives Dr
- 5710 Rives Dr
- 5725 Kennemore Dr
- 5720 Rives Dr
- 5970 Shepherds Pond
- 5725 Rives Dr
- 5710 Kennemore Dr
- 5980 Shepherds Pond
- 600 Union Hill Rd
- 1175 Mullinax Rd
- 5715 Kennemore Dr
- 5960 Shepherds Pond
- 5730 Rives Dr