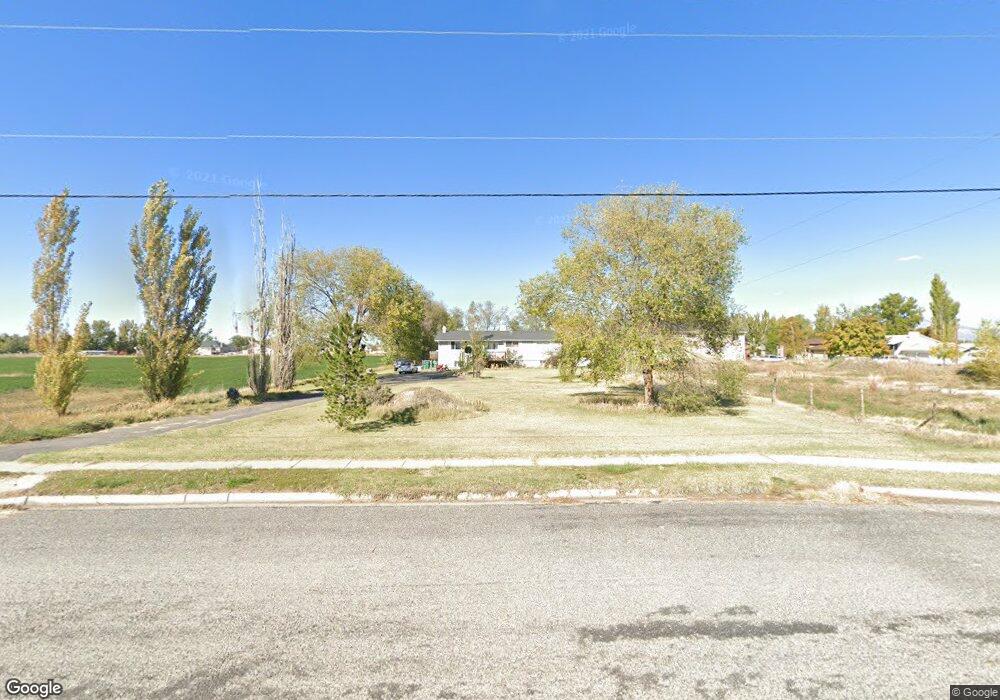
5750 W 5500 S Hooper, UT 84315
Estimated Value: $518,000 - $578,000
5
Beds
2
Baths
1,500
Sq Ft
$364/Sq Ft
Est. Value
About This Home
This home is located at 5750 W 5500 S, Hooper, UT 84315 and is currently estimated at $545,445, approximately $363 per square foot. 5750 W 5500 S is a home located in Weber County with nearby schools including Hooper Elementary School, Rocky Mountain Junior High School, and Quest Academy.
Ownership History
Date
Name
Owned For
Owner Type
Purchase Details
Closed on
Aug 11, 2020
Sold by
James Tyler and James Ashley
Bought by
James Tyler
Current Estimated Value
Home Financials for this Owner
Home Financials are based on the most recent Mortgage that was taken out on this home.
Original Mortgage
$280,000
Interest Rate
3%
Mortgage Type
New Conventional
Purchase Details
Closed on
Apr 11, 2019
Sold by
James Tyler
Bought by
James Tyler and James Ashley
Home Financials for this Owner
Home Financials are based on the most recent Mortgage that was taken out on this home.
Original Mortgage
$256,000
Interest Rate
4.3%
Mortgage Type
New Conventional
Purchase Details
Closed on
Sep 18, 2018
Sold by
James Russell W
Bought by
James Vicki A
Create a Home Valuation Report for This Property
The Home Valuation Report is an in-depth analysis detailing your home's value as well as a comparison with similar homes in the area
Home Values in the Area
Average Home Value in this Area
Purchase History
| Date | Buyer | Sale Price | Title Company |
|---|---|---|---|
| James Tyler | -- | Mountain View Title Ogden | |
| James Tyler | -- | Mountain View Title Ogden | |
| James Tyler | -- | Mountain View Title Ogden | |
| James Vicki A | -- | None Available |
Source: Public Records
Mortgage History
| Date | Status | Borrower | Loan Amount |
|---|---|---|---|
| Closed | James Tyler | $280,000 | |
| Closed | James Tyler | $256,000 |
Source: Public Records
Tax History
| Year | Tax Paid | Tax Assessment Tax Assessment Total Assessment is a certain percentage of the fair market value that is determined by local assessors to be the total taxable value of land and additions on the property. | Land | Improvement |
|---|---|---|---|---|
| 2025 | $2,810 | $490,031 | $179,965 | $310,066 |
| 2024 | $2,709 | $264,549 | $98,980 | $165,569 |
| 2023 | $2,722 | $263,450 | $123,748 | $139,702 |
| 2022 | $2,856 | $282,700 | $99,002 | $183,698 |
| 2021 | $2,325 | $388,000 | $110,068 | $277,932 |
| 2020 | $2,283 | $349,000 | $90,008 | $258,992 |
| 2019 | $1,923 | $278,000 | $63,000 | $215,000 |
| 2018 | $1,765 | $244,000 | $63,000 | $181,000 |
| 2017 | $1,494 | $200,000 | $63,000 | $137,000 |
| 2016 | $1,321 | $95,475 | $24,798 | $70,677 |
| 2015 | $1,293 | $92,109 | $24,798 | $67,311 |
| 2014 | $1,273 | $88,195 | $29,150 | $59,045 |
Source: Public Records
Map
Nearby Homes
- 5603 W 5600 S
- 0 W 5500 S
- 5731 W 4100 S
- 5777 W 4100 S
- 6014 W 5300 S
- 6042 W 5700 S
- 5785 S 6000 W
- 6030 W 5800 S
- 3664 S 5400 W Unit 13
- 5035 S 6150 W
- 6242 W 5950 S
- 5957 W 4700 S
- 3729 S 5600 W Unit 6
- 3672 S 5600 W Unit 23
- 3720 S 5600 W Unit 2
- 3732 S 5600 W Unit 3
- 3719 S 5600 W Unit 7
- 6036 W 4700 S
- 4879 S 5050 W
- 4836 S 5050 W
Your Personal Tour Guide
Ask me questions while you tour the home.