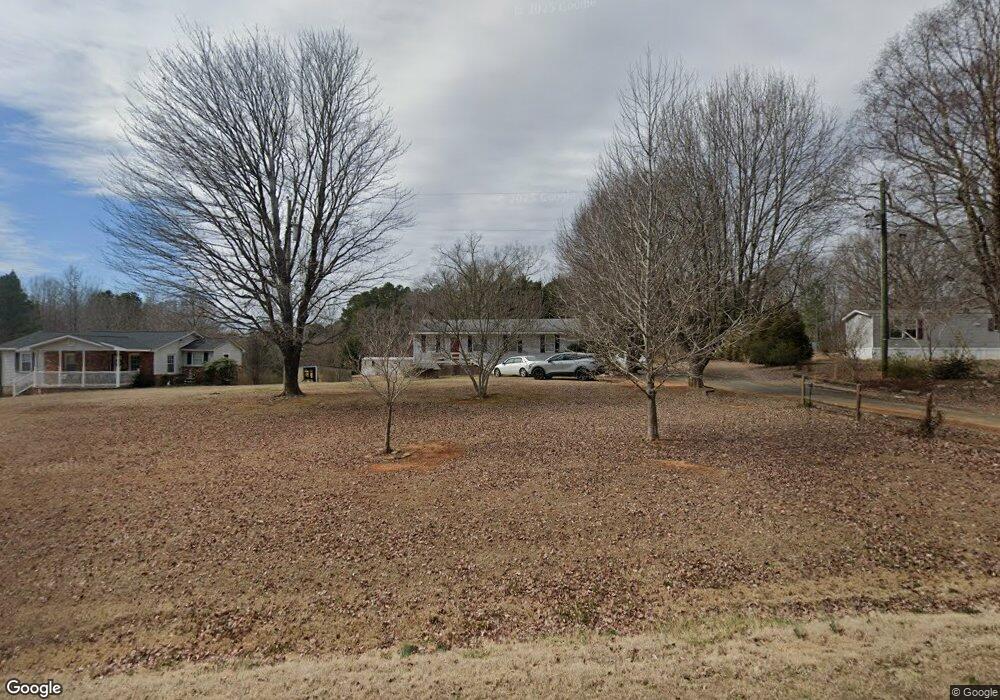
5753 Hobgood Rd Rougemont, NC 27572
Estimated Value: $143,000 - $234,000
--
Bed
2
Baths
1,056
Sq Ft
$164/Sq Ft
Est. Value
About This Home
This home is located at 5753 Hobgood Rd, Rougemont, NC 27572 and is currently estimated at $172,909, approximately $163 per square foot. 5753 Hobgood Rd is a home located in Granville County with nearby schools including West Oxford Elementary School, Northern Granville Middle School, and Granville Central High School.
Ownership History
Date
Name
Owned For
Owner Type
Purchase Details
Closed on
May 19, 2025
Sold by
Mcgee Brandal Edward
Bought by
Owen Kalyn Amber
Current Estimated Value
Purchase Details
Closed on
Dec 28, 2000
Bought by
Owen Teresa M
Create a Home Valuation Report for This Property
The Home Valuation Report is an in-depth analysis detailing your home's value as well as a comparison with similar homes in the area
Home Values in the Area
Average Home Value in this Area
Purchase History
| Date | Buyer | Sale Price | Title Company |
|---|---|---|---|
| Owen Kalyn Amber | -- | None Listed On Document | |
| Owen Kalyn Amber | -- | None Listed On Document | |
| Owen Teresa M | -- | -- |
Source: Public Records
Tax History Compared to Growth
Tax History
| Year | Tax Paid | Tax Assessment Tax Assessment Total Assessment is a certain percentage of the fair market value that is determined by local assessors to be the total taxable value of land and additions on the property. | Land | Improvement |
|---|---|---|---|---|
| 2025 | $869 | $108,779 | $15,625 | $93,154 |
| 2024 | $869 | $108,779 | $15,625 | $93,154 |
| 2023 | $635 | $57,391 | $9,063 | $48,328 |
| 2022 | $264 | $57,391 | $9,063 | $48,328 |
| 2021 | $247 | $57,391 | $9,063 | $48,328 |
| 2020 | $247 | $57,391 | $9,063 | $48,328 |
| 2019 | $247 | $57,391 | $9,063 | $48,328 |
| 2018 | $247 | $57,391 | $9,063 | $48,328 |
| 2016 | $231 | $51,139 | $8,125 | $43,014 |
| 2015 | $218 | $51,139 | $8,125 | $43,014 |
| 2014 | $218 | $51,139 | $8,125 | $43,014 |
| 2013 | -- | $51,139 | $8,125 | $43,014 |
Source: Public Records
Map
Nearby Homes
- 316 Acorn Ct
- 00 Mann Oakley Rd
- 0 Old Roxboro Rd Unit 10027603
- 6708 Old Roxboro Rd
- 153 Ninovan Place
- 6688 Goshen Rd
- 24 Acres Bob Daniel Rd
- 5586 Shelton Creek Rd
- 5021 Clayton Rd
- Lot 6 & 7 Hunters Cir
- 1545 Dogwood Dr
- 5075 Range Rd
- 0 Owens Daye Rd
- Lot 3 Uzzle Rd
- Lot 2 Uzzle Rd
- 670 Tingen Mine Rd
- 195 Falcon Ln
- 7810 Helena Moriah Rd
- 576 Duncan Rd
- 00 Pulliam-Tingen Mine Rd
- 5751 Hobgood Rd
- 5757 Hobgood Rd
- 5759 Hobgood Rd
- 5749 Hobgood Rd
- 5743 Hobgood Rd
- 5746 Hobgood Rd
- 5746 Hobgood Rd
- 6001 Hobgood Rd
- 5739 Hobgood Rd
- 6006 Hobgood Rd
- 5742 Hobgood Rd
- 5729 Hobgood Rd
- 544 Us Highway 158
- 550 Us Highway 158
- 564 Us Highway 158
- 5728 Hobgood Rd
- 539 Us Highway 158
- 539 W Hwy 158
- 0 Hobgood Rd
- 531 Us Highway 158