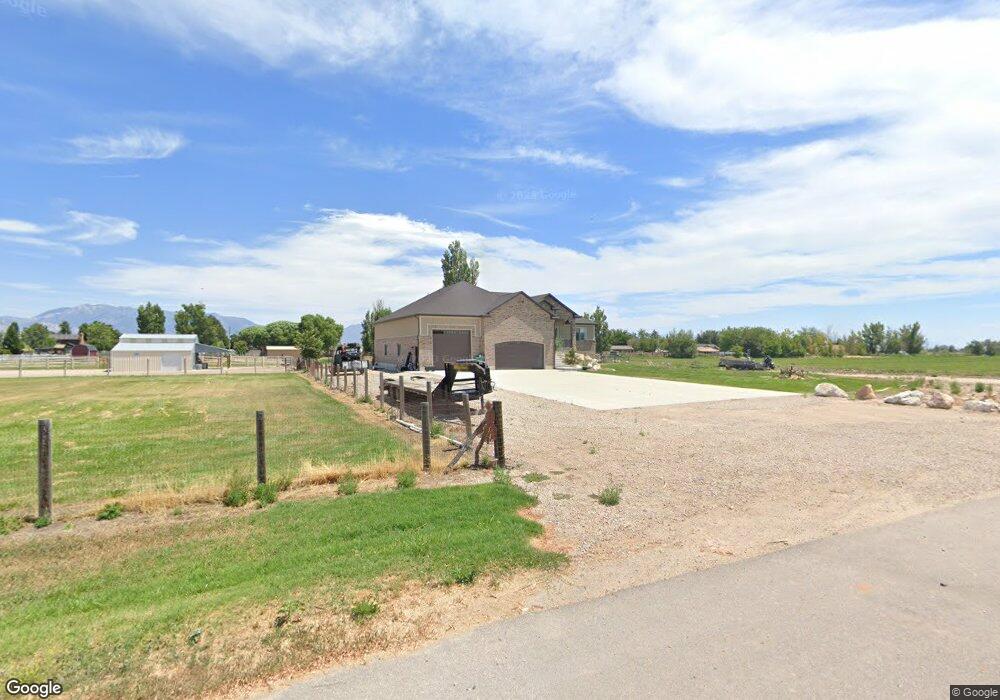
5754 S 6800 W Hooper, UT 84315
Estimated Value: $707,000 - $1,278,785
5
Beds
4
Baths
2,337
Sq Ft
$436/Sq Ft
Est. Value
About This Home
This home is located at 5754 S 6800 W, Hooper, UT 84315 and is currently estimated at $1,019,595, approximately $436 per square foot. 5754 S 6800 W is a home with nearby schools including Hooper Elementary School, Rocky Mountain Junior High School, and Fremont High School.
Ownership History
Date
Name
Owned For
Owner Type
Purchase Details
Closed on
Jan 23, 2016
Sold by
Bell Built Homes Inc
Bought by
Bell Built Homes Inc and Naisbitt Sloan D
Current Estimated Value
Home Financials for this Owner
Home Financials are based on the most recent Mortgage that was taken out on this home.
Original Mortgage
$414,175
Outstanding Balance
$328,970
Interest Rate
3.92%
Mortgage Type
Construction
Estimated Equity
$690,625
Purchase Details
Closed on
Jan 19, 2016
Sold by
Naisbitt Sloan D and Naisbitt Michell L
Bought by
Bell Built Homes Inc
Home Financials for this Owner
Home Financials are based on the most recent Mortgage that was taken out on this home.
Original Mortgage
$414,175
Outstanding Balance
$328,970
Interest Rate
3.92%
Mortgage Type
Construction
Estimated Equity
$690,625
Create a Home Valuation Report for This Property
The Home Valuation Report is an in-depth analysis detailing your home's value as well as a comparison with similar homes in the area
Home Values in the Area
Average Home Value in this Area
Purchase History
| Date | Buyer | Sale Price | Title Company |
|---|---|---|---|
| Bell Built Homes Inc | -- | Mountain View Title | |
| Bell Built Homes Inc | -- | Mountain View Title |
Source: Public Records
Mortgage History
| Date | Status | Borrower | Loan Amount |
|---|---|---|---|
| Open | Bell Built Homes Inc | $414,175 |
Source: Public Records
Tax History Compared to Growth
Tax History
| Year | Tax Paid | Tax Assessment Tax Assessment Total Assessment is a certain percentage of the fair market value that is determined by local assessors to be the total taxable value of land and additions on the property. | Land | Improvement |
|---|---|---|---|---|
| 2025 | $6,828 | $1,125,927 | $338,765 | $787,162 |
| 2024 | $6,570 | $678,109 | $257,780 | $420,329 |
| 2023 | $5,612 | $572,113 | $198,252 | $373,861 |
| 2022 | $5,836 | $562,100 | $131,586 | $430,514 |
| 2021 | $5,145 | $835,000 | $184,400 | $650,600 |
| 2020 | $4,761 | $699,000 | $169,408 | $529,592 |
| 2019 | $4,918 | $682,000 | $169,400 | $512,600 |
| 2018 | $4,965 | $657,000 | $169,400 | $487,600 |
| 2017 | $12,993 | $615,000 | $149,550 | $465,450 |
| 2016 | -- | $0 | $0 | $0 |
Source: Public Records
Map
Nearby Homes
- 5801 S 7100 W
- 5319 S 7100 W
- 6360 W 5500 S
- 5752 W 2425 N
- 0 W 5500 S
- 6014 W 5300 S
- 6036 W 4700 S
- 5335 W 5500 S
- 4100 S 5900 W
- 2084 N 4500 W
- 3729 S 5600 W Unit 6
- 3720 S 5600 W Unit 2
- 3719 S 5600 W Unit 7
- 3632 S 5400 W
- 4146 S 5800 W Unit 5
- 4163 S 5800 W Unit 2
- 2462 N Hooded Crane Ct
- 4302 W 1550 N
- 4879 S 5050 W
- 2444 N Hooded Crane Cir Unit 11