NOT LISTED FOR SALE

5754 Salakanum Way Bellingham, WA 98226

Estimated Value: $552,000 - $671,146

2 Beds
3 Baths
2,336 Sq Ft
$266/Sq Ft Est. Value

Last Sold October 27, 2017

Last sale price $322,000 $138 Per Sq Ft

Est. 93% increase in value since last sale

Current estimated payment $3,635/month

About This Home

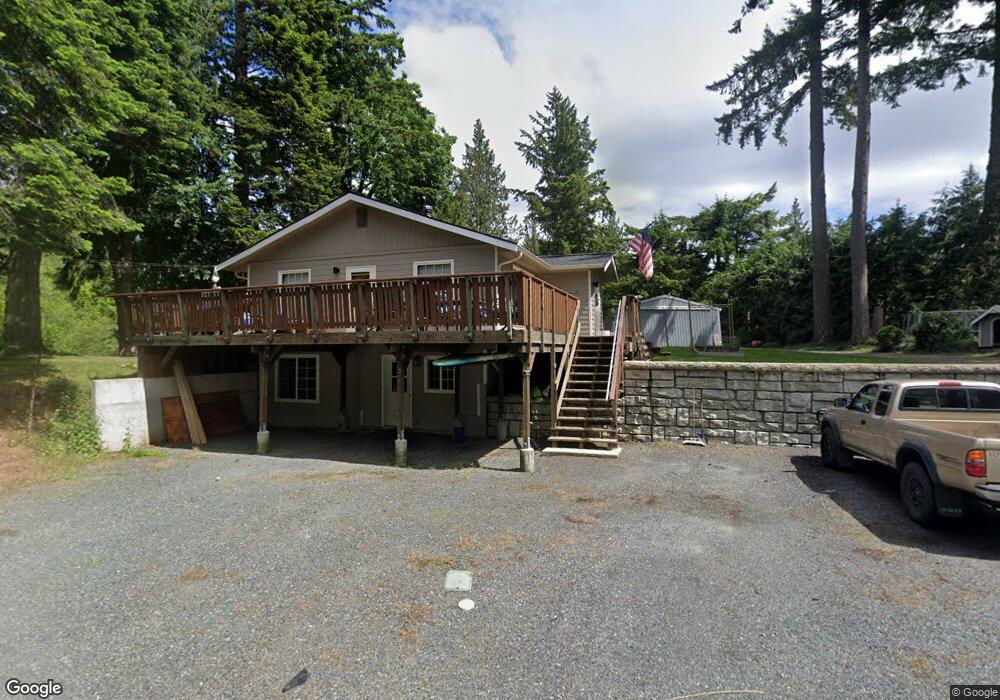
So much potential in this well-built 2 bedroom home on 2+ acres overlooking Anderson Creek. Double stud wall framing with fireproof sheet-rock around entire house, outside is wrapped in solid cedar siding that has been sealed on both sides. There is a full bath, 3/4 bath and a 1/2 bath. An attached 3 car finished garage as well as a separate 28 x 40 shop, all reached by a paved driveway from a private paved road just minutes to town.

Ownership History

Date Name Owned For Owner Type

Purchase Details

Listed on
Jul 7, 2017
Closed on
Oct 23, 2017
Sold by
Dawkins Jean R
Bought by
House Martin
Seller's Agent
Monica Colville
ONE Realty
Buyer's Agent
Diva Menke-Thielman
Bellwether Real Estate
List Price
$329,000
Sold Price
$322,000
Premium/Discount to List
-$7,000
-2.13%
Current Estimated Value
$622,537

Home Financials for this Owner

Home Financials are based on the most recent Mortgage that was taken out on this home.
Estimated Appreciation
$300,537
Avg. Annual Appreciation
8.46%
Original Mortgage
$294,871
Outstanding Balance
$246,630
Interest Rate
3.87%
Mortgage Type
FHA
Estimated Equity
$375,907
Source: Public Records

Range of Values:

--
Value Increase
--
Percent Increase
--
Adjusted for Inflation
Collateral Analytics

Collateral Analytics Collateral Analytics AVMs (Automated Valuation Model) employ a number of statistical approaches combined with neighborhood-specific comparable selection guarantees the most up-to-date and precise valuations.

Not Available

Collateral Analytics does not have data for the current month. Please view the chart for historical values.

ICE

ICE Mortgage Technology ICE Mortgage Technology’s AVM (Automated Valuation Model) is a state-of-the-art online residential property valuation tool that provides a quick and accurate estimate of the value of almost any home in the U.S.

Not Available

ICE Mortgage Technology does not have data for the current month. Please view the chart for historical values.

First American

First American First American Data & Analytics’ next-generation AVM combines unrivaled data assets with a blended ensemble of valuation models to produce highly accurate, reliable valuations you can trust.

Not Available

First American does not have data for the current month. Please view the chart for historical values.

Quantarium

Quantarium Quantarium’s valuation service, repeatedly proven the industry’s most accurate and comprehensive, is supercharged with a self-learning and auto-tuning AI engine that continually becomes smarter and more accurate as it processes daily inputs from the industry’s leading RE data lake.

Not Available

Quantarium does not have data for the current month. Please view the chart for historical values.

Average Value
Not Available
List Price
Sold Price
Create a Home Valuation Report for This Property
The Home Valuation Report is an in-depth analysis detailing your home's value as well as a comparison with similar homes in the area

Home Values in the Area

Source: Public Records

Average Home Value in this Area


Source: Public Records

Purchase History

Date Buyer Sale Price Title Company
House Martin $322,000 Chicago Title Insurance
Source: Public Records

Mortgage History

Date Status Borrower Loan Amount
Open House Martin $294,871
Source: Public Records

Property History

Date Event Price List to Sale Price per Sq Ft Prior Sale
10/27/2017 10/27/17 Sold $322,000 -2.1% $138 / Sq Ft View Prior Sale
09/16/2017 09/16/17 Pending -- -- --
09/07/2017 09/07/17 For Sale $329,000 0.0% $141 / Sq Ft
08/19/2017 08/19/17 Pending -- -- --
07/24/2017 07/24/17 For Sale $329,000 -- $141 / Sq Ft

Tax History Compared to Growth

Source: Public Records

Tax History

Year Tax Paid Tax Assessment Tax Assessment Total Assessment is a certain percentage of the fair market value that is determined by local assessors to be the total taxable value of land and additions on the property. Land Improvement
2024 $4,317 $602,316 $260,308 $342,008
2023 $4,317 $585,807 $285,353 $300,454
2022 $3,788 $480,158 $233,890 $246,268
2021 $3,427 $387,220 $188,619 $198,601
2020 $3,161 $328,151 $159,846 $168,305
2019 $2,830 $289,126 $140,836 $148,290
2018 $3,545 $278,756 $135,785 $142,971
2017 $541 $276,581 $130,078 $146,503
2016 $537 $266,977 $125,561 $141,416
2015 $514 $254,974 $119,916 $135,058
2014 -- $0 $0 $0
2013 -- $0 $0 $0
Source: Public Records

Agents Affiliated with this Home

  • Section Image
  • Section Image
See All Agents

Map