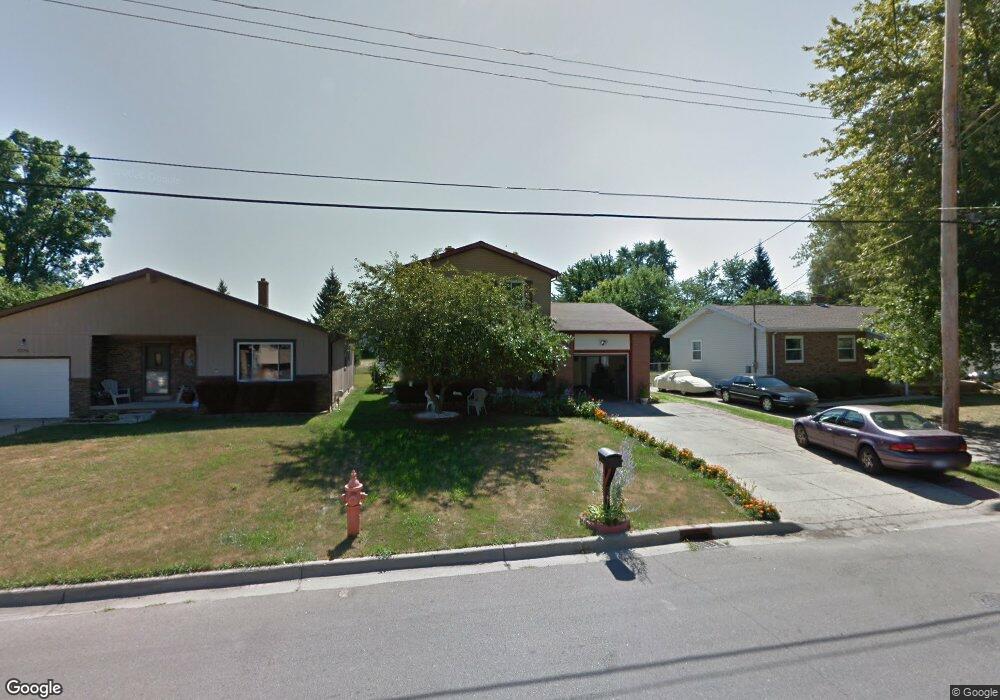
5755 Joshua St Lansing, MI 48911
South Lansing NeighborhoodEstimated Value: $144,000 - $190,000
--
Bed
--
Bath
1,246
Sq Ft
$130/Sq Ft
Est. Value
About This Home
This home is located at 5755 Joshua St, Lansing, MI 48911 and is currently estimated at $161,681, approximately $129 per square foot. 5755 Joshua St is a home located in Ingham County with nearby schools including Kendon School, Attwood School, and Everett High School.
Ownership History
Date
Name
Owned For
Owner Type
Purchase Details
Closed on
Jan 6, 2004
Sold by
Henrys Michael J and Henrys Leah L
Bought by
Avdic Mujo and Avdic Suada
Current Estimated Value
Home Financials for this Owner
Home Financials are based on the most recent Mortgage that was taken out on this home.
Original Mortgage
$91,200
Outstanding Balance
$42,680
Interest Rate
5.91%
Mortgage Type
Purchase Money Mortgage
Estimated Equity
$119,001
Purchase Details
Closed on
Feb 14, 1997
Sold by
Hildebert Hilz
Bought by
Henrys Michael J
Create a Home Valuation Report for This Property
The Home Valuation Report is an in-depth analysis detailing your home's value as well as a comparison with similar homes in the area
Home Values in the Area
Average Home Value in this Area
Purchase History
| Date | Buyer | Sale Price | Title Company |
|---|---|---|---|
| Avdic Mujo | $114,000 | Fatic | |
| Henrys Michael J | $75,800 | -- |
Source: Public Records
Mortgage History
| Date | Status | Borrower | Loan Amount |
|---|---|---|---|
| Open | Avdic Mujo | $91,200 |
Source: Public Records
Tax History Compared to Growth
Tax History
| Year | Tax Paid | Tax Assessment Tax Assessment Total Assessment is a certain percentage of the fair market value that is determined by local assessors to be the total taxable value of land and additions on the property. | Land | Improvement |
|---|---|---|---|---|
| 2025 | $2,532 | $68,300 | $7,700 | $60,600 |
| 2024 | $20 | $53,400 | $7,700 | $45,700 |
| 2023 | $2,375 | $48,000 | $7,700 | $40,300 |
| 2022 | $2,143 | $43,100 | $7,000 | $36,100 |
| 2021 | $2,098 | $42,000 | $6,100 | $35,900 |
| 2020 | $2,085 | $41,200 | $6,100 | $35,100 |
| 2019 | $1,998 | $35,100 | $6,100 | $29,000 |
| 2018 | $1,874 | $33,100 | $6,100 | $27,000 |
| 2017 | $1,793 | $33,100 | $6,100 | $27,000 |
| 2016 | $1,715 | $32,500 | $6,100 | $26,400 |
| 2015 | $1,715 | $31,600 | $12,240 | $19,360 |
| 2014 | $1,715 | $30,100 | $15,300 | $14,800 |
Source: Public Records
Map
Nearby Homes
- 5808 Orchard Ct
- 5750 Orchard Ct
- 5724 Orchard Ct
- 354 E Miller Rd
- 123 E Miller Rd
- 6223 Beechfield Dr Unit 8
- 6029 Ellendale Dr
- 6300 Beechfield Dr Unit 87
- 1101 Barr Ave
- 5636 Ellendale Dr
- 6309 Beechfield Dr Unit 45
- 6028 Rolfe Rd
- 4901 Southgate Ave
- 4901 Allison Dr
- 6429 Rosedale Rd
- 5821 Schafer Rd
- 4733 S Pennsylvania Ave
- 501 Bluebell Dr
- 5011 Stafford Ave
- 6444 Sommerset Rd