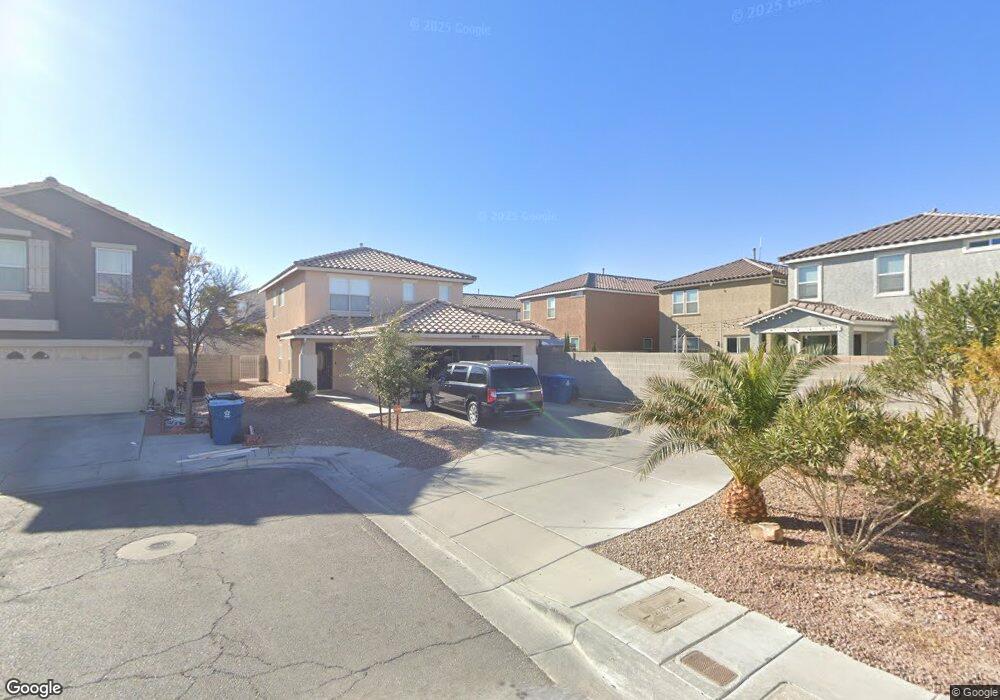
5755 Viberti Ct Las Vegas, NV 89118
Estimated Value: $403,000 - $437,000
3
Beds
3
Baths
1,727
Sq Ft
$244/Sq Ft
Est. Value
About This Home
This home is located at 5755 Viberti Ct, Las Vegas, NV 89118 and is currently estimated at $420,691, approximately $243 per square foot. 5755 Viberti Ct is a home located in Clark County with nearby schools including Helen Jydstrup Elementary School, Grant Sawyer Middle School, and Durango High School.
Ownership History
Date
Name
Owned For
Owner Type
Purchase Details
Closed on
Sep 28, 2016
Sold by
Shimels Genet Ahunea
Bought by
Gebru Hailemickael T
Current Estimated Value
Home Financials for this Owner
Home Financials are based on the most recent Mortgage that was taken out on this home.
Original Mortgage
$197,359
Outstanding Balance
$161,445
Interest Rate
4.12%
Mortgage Type
FHA
Estimated Equity
$259,246
Purchase Details
Closed on
Dec 19, 2001
Sold by
Wu Barbara
Bought by
Woo Wayland
Home Financials for this Owner
Home Financials are based on the most recent Mortgage that was taken out on this home.
Original Mortgage
$135,200
Interest Rate
6.51%
Purchase Details
Closed on
Dec 18, 2001
Sold by
Kb Home Nevada Inc
Bought by
Young Darrel and Woo Wayland
Home Financials for this Owner
Home Financials are based on the most recent Mortgage that was taken out on this home.
Original Mortgage
$135,200
Interest Rate
6.51%
Create a Home Valuation Report for This Property
The Home Valuation Report is an in-depth analysis detailing your home's value as well as a comparison with similar homes in the area
Home Values in the Area
Average Home Value in this Area
Purchase History
| Date | Buyer | Sale Price | Title Company |
|---|---|---|---|
| Gebru Hailemickael T | -- | Ticor Title Las Vegas | |
| Gebru Hailemickael T | $201,000 | Ticor Title Las Vegas | |
| Woo Wayland | -- | Ticor Title Las Vegas | |
| Young Darrell | -- | Ticor Title Las Vegas | |
| Woo Wayland | -- | First American Title Co | |
| Young Darrel | $169,003 | First American Title Co |
Source: Public Records
Mortgage History
| Date | Status | Borrower | Loan Amount |
|---|---|---|---|
| Open | Gebru Hailemickael T | $197,359 | |
| Previous Owner | Young Darrel | $135,200 | |
| Closed | Young Darrel | $16,500 |
Source: Public Records
Tax History Compared to Growth
Tax History
| Year | Tax Paid | Tax Assessment Tax Assessment Total Assessment is a certain percentage of the fair market value that is determined by local assessors to be the total taxable value of land and additions on the property. | Land | Improvement |
|---|---|---|---|---|
| 2025 | $2,275 | $98,971 | $30,800 | $68,171 |
| 2024 | $2,107 | $98,971 | $30,800 | $68,171 |
| 2023 | $1,403 | $95,113 | $30,800 | $64,313 |
| 2022 | $1,951 | $83,964 | $25,200 | $58,764 |
| 2021 | $1,807 | $80,040 | $24,150 | $55,890 |
| 2020 | $1,675 | $77,131 | $21,700 | $55,431 |
| 2019 | $1,570 | $73,814 | $19,250 | $54,564 |
| 2018 | $1,498 | $67,606 | $15,400 | $52,206 |
| 2017 | $1,971 | $67,204 | $14,350 | $52,854 |
| 2016 | $1,403 | $64,293 | $11,550 | $52,743 |
| 2015 | $1,399 | $53,793 | $7,000 | $46,793 |
| 2014 | $1,356 | $44,847 | $7,000 | $37,847 |
Source: Public Records
Map
Nearby Homes
- 5691 Leaning Oak Ave
- 5565 Autumn Cliffs Way
- 5877 Capsicum Ct
- 6012 Prospector Trail
- 5876 Pack Trail
- 5607 W Dewey Dr
- 5332 Chili Pepper St
- 5266 Tropical Peach Dr
- 5508 Ness Ave
- 5273 Wave Dancer Ln
- 5266 Souvenir Ln
- 5240 Island Chain Rd
- 5221 Lindell Rd Unit 202
- 5221 Lindell Rd Unit 206
- 5237 Wave Dancer Ln
- 5218 Pat Place
- 5958 Greenery View Ln
- 5354 Silver Branch Ave
- 5130 S Jones Blvd Unit 102
- 5605 Coder Ct
- 5755 Viberti Ct Unit none
- 5741 Viberti Ct
- 5532 Autumn Cliffs Way Unit Master Bedroom
- 5532 Autumn Cliffs Way Unit Street Bedroom
- 5532 Autumn Cliffs Way Unit Side Bedroom
- 5532 Autumn Cliffs Way
- 5538 Autumn Cliffs Way
- 5727 Viberti Ct Unit 3
- 5526 Autumn Cliffs Way
- 5544 Autumn Cliffs Way
- 5742 Butterick Ct
- 5520 Autumn Cliffs Way
- 5756 Butterick Ct
- 5550 Autumn Cliffs Way
- 5728 Butterick Ct
- 5514 Autumn Cliffs Way
- 5556 Autumn Cliffs Way
- 5740 Viberti Ct
- 5726 Viberti Ct