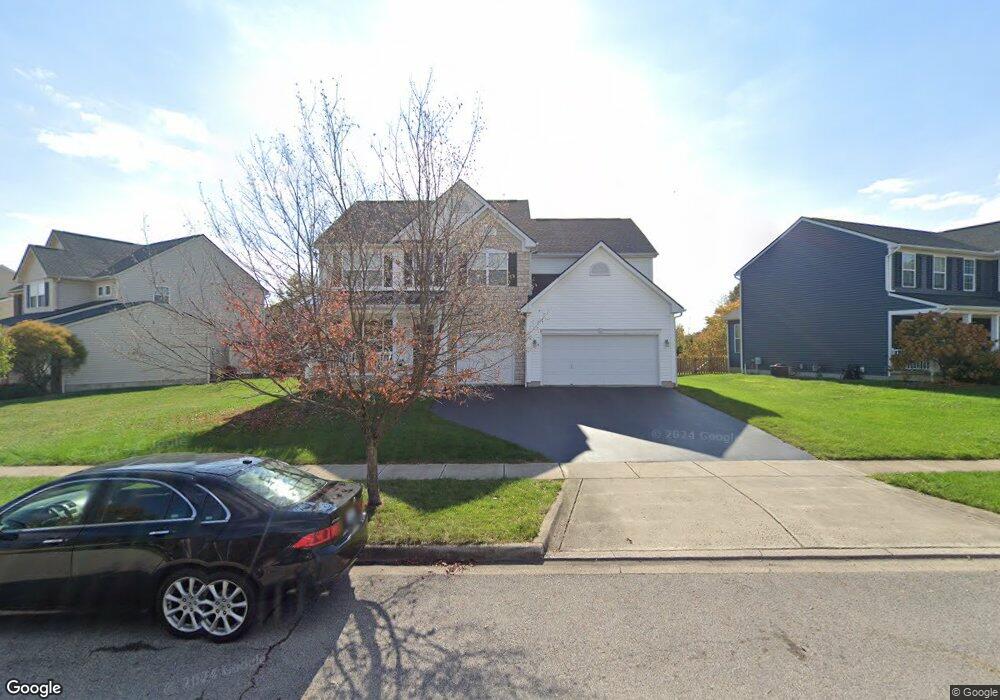
5756 Platinum Dr Grove City, OH 43123
Estimated Value: $450,000 - $499,000
4
Beds
3
Baths
3,161
Sq Ft
$150/Sq Ft
Est. Value
About This Home
This home is located at 5756 Platinum Dr, Grove City, OH 43123 and is currently estimated at $475,072, approximately $150 per square foot. 5756 Platinum Dr is a home located in Franklin County with nearby schools including Buckeye Woods Elementary School, Hayes Intermediate School, and Jackson Middle School.
Ownership History
Date
Name
Owned For
Owner Type
Purchase Details
Closed on
Dec 16, 2011
Sold by
Pullie Robert L and Pullie Ada L
Bought by
Steel Bryce A and Steel Lori L
Current Estimated Value
Home Financials for this Owner
Home Financials are based on the most recent Mortgage that was taken out on this home.
Original Mortgage
$162,000
Outstanding Balance
$110,819
Interest Rate
4.01%
Mortgage Type
New Conventional
Estimated Equity
$364,253
Purchase Details
Closed on
Jun 1, 2006
Sold by
Beazer Homes Investments Llc
Bought by
Pullie Robert L and Pullie Ada L
Home Financials for this Owner
Home Financials are based on the most recent Mortgage that was taken out on this home.
Original Mortgage
$212,960
Interest Rate
6.68%
Mortgage Type
Fannie Mae Freddie Mac
Purchase Details
Closed on
Jan 20, 2006
Sold by
Cross/Joshua Llc
Bought by
Beazer Homes Investments Llc
Create a Home Valuation Report for This Property
The Home Valuation Report is an in-depth analysis detailing your home's value as well as a comparison with similar homes in the area
Home Values in the Area
Average Home Value in this Area
Purchase History
| Date | Buyer | Sale Price | Title Company |
|---|---|---|---|
| Steel Bryce A | $180,000 | Talon Group | |
| Pullie Robert L | $266,200 | Preferred T | |
| Beazer Homes Investments Llc | $46,000 | Preferred T |
Source: Public Records
Mortgage History
| Date | Status | Borrower | Loan Amount |
|---|---|---|---|
| Open | Steel Bryce A | $162,000 | |
| Closed | Pullie Robert L | $212,960 |
Source: Public Records
Tax History Compared to Growth
Tax History
| Year | Tax Paid | Tax Assessment Tax Assessment Total Assessment is a certain percentage of the fair market value that is determined by local assessors to be the total taxable value of land and additions on the property. | Land | Improvement |
|---|---|---|---|---|
| 2024 | $6,432 | $141,440 | $34,300 | $107,140 |
| 2023 | $6,341 | $141,435 | $34,300 | $107,135 |
| 2022 | $6,574 | $107,800 | $21,000 | $86,800 |
| 2021 | $6,701 | $107,800 | $21,000 | $86,800 |
| 2020 | $6,679 | $107,800 | $21,000 | $86,800 |
| 2019 | $6,012 | $90,020 | $17,500 | $72,520 |
| 2018 | $6,014 | $90,020 | $17,500 | $72,520 |
| 2017 | $6,001 | $90,020 | $17,500 | $72,520 |
| 2016 | $6,035 | $83,270 | $13,410 | $69,860 |
| 2015 | $6,037 | $83,270 | $13,410 | $69,860 |
| 2014 | $6,042 | $83,270 | $13,410 | $69,860 |
| 2013 | $2,716 | $79,310 | $12,775 | $66,535 |
Source: Public Records
Map
Nearby Homes
- 1657 Ainwick Bend Unit A
- 5828 Wynnewood Dr
- 1645 Withers Grove Loop
- 5971 Wynnewood Dr
- 1669 Bookfield Ln
- 1658 Bookfield Ln
- 1675 Bookfield Ln
- 1664 Bookfield Ln
- 1672 Bookfield Ln
- 1683 Bookfield Ln
- 1689 Bookfield Ln
- 1390 Hemetite Dr
- 5712 Buckeye Pkwy
- 5793 Daffodil Ct
- 5976 Sweet Basil Ln
- 5954 Blue Star Dr
- 5990 Sweet Basil Ln
- 5962 Sweet Basil Ln
- 6004 Sweet Basil Ln
- 6092 Winnebago St
- 5746 Platinum Dr
- 5776 Platinum Dr
- 5817 Goldstone Ct
- 5736 Platinum Dr
- 5806 Platinum Dr
- 5761 Platinum Dr
- 5751 Platinum Dr
- 5771 Platinum Dr
- 5810 Goldstone Ct
- 5816 Platinum Dr
- 5722 Platinum Dr
- 5741 Platinum Dr
- 5827 Goldstone Ct
- 5781 Platinum Dr
- 5731 Platinum Dr
- 5826 Platinum Dr
- 5826 Platinum Dr Unit GR174
- 5791 Platinum Dr
- 5801 Platinum Dr
- 5801 Platinum Dr Unit GR92