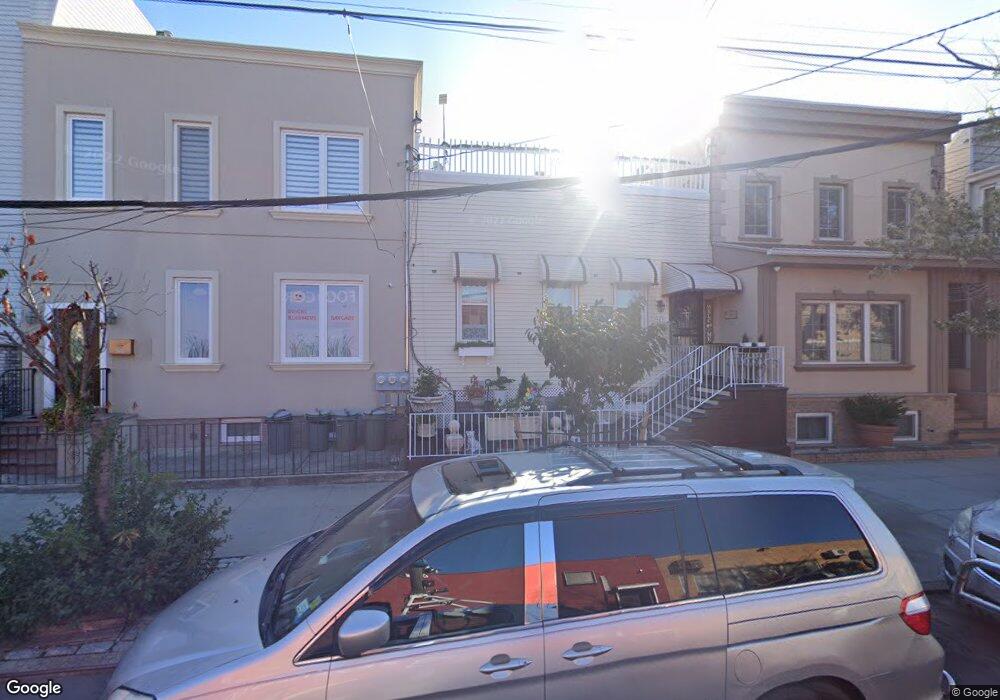
5757 59th St Maspeth, NY 11378
Maspeth NeighborhoodEstimated Value: $643,013 - $835,000
Studio
--
Bath
775
Sq Ft
$945/Sq Ft
Est. Value
About This Home
This home is located at 5757 59th St, Maspeth, NY 11378 and is currently estimated at $732,503, approximately $945 per square foot. 5757 59th St is a home located in Queens County with nearby schools including P.S. 153 Maspeth, IS 73 - The Frank Sansivieri School, and Grover Cleveland High School.
Ownership History
Date
Name
Owned For
Owner Type
Purchase Details
Closed on
Dec 26, 1997
Sold by
Guelbart Daniel M and Guelbart Christine T
Bought by
Osario Carlos and Oliveras Elvira M
Current Estimated Value
Home Financials for this Owner
Home Financials are based on the most recent Mortgage that was taken out on this home.
Original Mortgage
$139,092
Outstanding Balance
$24,033
Interest Rate
7.09%
Mortgage Type
FHA
Estimated Equity
$708,470
Create a Home Valuation Report for This Property
The Home Valuation Report is an in-depth analysis detailing your home's value as well as a comparison with similar homes in the area
Home Values in the Area
Average Home Value in this Area
Purchase History
| Date | Buyer | Sale Price | Title Company |
|---|---|---|---|
| Osario Carlos | $140,000 | Commonwealth Land Title Ins |
Source: Public Records
Mortgage History
| Date | Status | Borrower | Loan Amount |
|---|---|---|---|
| Open | Osario Carlos | $139,092 |
Source: Public Records
Tax History
| Year | Tax Paid | Tax Assessment Tax Assessment Total Assessment is a certain percentage of the fair market value that is determined by local assessors to be the total taxable value of land and additions on the property. | Land | Improvement |
|---|---|---|---|---|
| 2025 | $3,605 | $20,491 | $6,756 | $13,735 |
| 2024 | $3,617 | $19,348 | $6,745 | $12,603 |
| 2023 | $3,605 | $19,348 | $7,045 | $12,303 |
| 2022 | $3,403 | $36,900 | $12,780 | $24,120 |
| 2021 | $3,413 | $39,480 | $12,780 | $26,700 |
| 2020 | $3,318 | $39,960 | $12,780 | $27,180 |
| 2019 | $3,080 | $44,040 | $12,780 | $31,260 |
| 2018 | $2,989 | $16,123 | $5,830 | $10,293 |
| 2017 | $2,841 | $15,405 | $6,576 | $8,829 |
| 2016 | $2,626 | $15,405 | $6,576 | $8,829 |
| 2015 | $1,533 | $14,230 | $7,461 | $6,769 |
| 2014 | $1,533 | $13,436 | $5,985 | $7,451 |
Source: Public Records
Map
Nearby Homes
Your Personal Tour Guide
Ask me questions while you tour the home.