5759 Cincinnati Columbus Rd S Waynesville, OH 45068
Wayne Township NeighborhoodEstimated Value: $264,000 - $318,000
3
Beds
2
Baths
1,328
Sq Ft
$215/Sq Ft
Est. Value
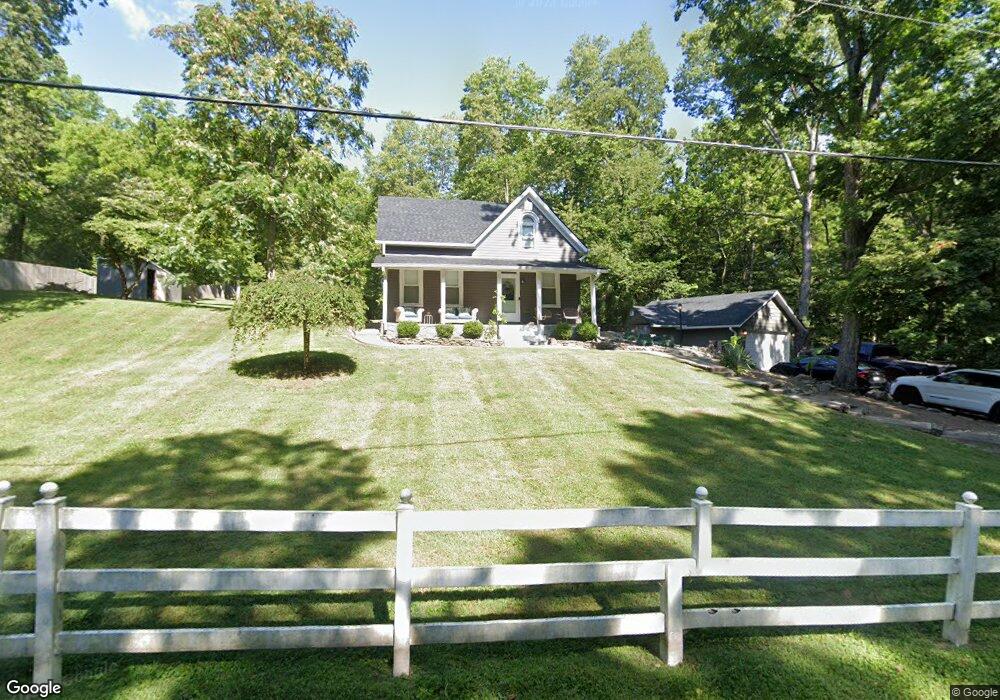
About This Home
This home is located at 5759 Cincinnati Columbus Rd S, Waynesville, OH 45068 and is currently estimated at $286,155, approximately $215 per square foot. 5759 Cincinnati Columbus Rd S is a home located in Warren County with nearby schools including Waynesville Elementary School, Waynesville Middle School, and Waynesville High School.
Ownership History
Date
Name
Owned For
Owner Type
Purchase Details
Closed on
Nov 13, 2015
Sold by
Richardson Rob M and Richardson Kelly
Bought by
Mullenix Kimberly S
Current Estimated Value
Purchase Details
Closed on
Feb 1, 2002
Sold by
Khuong Trang T
Bought by
Richardson Rob M and Richardson Kelly
Home Financials for this Owner
Home Financials are based on the most recent Mortgage that was taken out on this home.
Original Mortgage
$96,900
Interest Rate
7.26%
Mortgage Type
New Conventional
Purchase Details
Closed on
Aug 2, 1995
Sold by
Doug P Super
Bought by
Khuong Trang T and Hall Diana S
Purchase Details
Closed on
Jan 23, 1991
Sold by
Kent Walker and Kent A.
Bought by
Super Super and Super Doug P
Purchase Details
Closed on
Jun 9, 1987
Sold by
Knapp Larry P and Knapp Kristin
Bought by
Walker and Walker Kent A
Purchase Details
Closed on
Jan 19, 1978
Sold by
Miller Miller and Miller Frank
Create a Home Valuation Report for This Property
The Home Valuation Report is an in-depth analysis detailing your home's value as well as a comparison with similar homes in the area
Home Values in the Area
Average Home Value in this Area
Purchase History
| Date | Buyer | Sale Price | Title Company |
|---|---|---|---|
| Mullenix Kimberly S | -- | Attorney | |
| Richardson Rob M | $126,900 | -- | |
| Khuong Trang T | $99,900 | -- | |
| Super Super | $85,000 | -- | |
| Walker | $56,500 | -- | |
| -- | $31,500 | -- |
Source: Public Records
Mortgage History
| Date | Status | Borrower | Loan Amount |
|---|---|---|---|
| Previous Owner | Richardson Rob M | $96,900 | |
| Closed | Khuong Trang T | -- |
Source: Public Records
Tax History Compared to Growth
Tax History
| Year | Tax Paid | Tax Assessment Tax Assessment Total Assessment is a certain percentage of the fair market value that is determined by local assessors to be the total taxable value of land and additions on the property. | Land | Improvement |
|---|---|---|---|---|
| 2024 | $2,740 | $68,580 | $28,000 | $40,580 |
| 2023 | $2,381 | $52,300 | $16,264 | $36,036 |
| 2022 | $2,328 | $52,301 | $16,265 | $36,036 |
| 2021 | $2,232 | $52,301 | $16,265 | $36,036 |
| 2020 | $2,104 | $42,522 | $13,223 | $29,299 |
| 2019 | $2,105 | $42,522 | $13,223 | $29,299 |
| 2018 | $2,106 | $42,522 | $13,223 | $29,299 |
| 2017 | $2,050 | $38,616 | $11,988 | $26,628 |
| 2016 | $1,913 | $38,616 | $11,988 | $26,628 |
| 2015 | $1,916 | $38,616 | $11,988 | $26,628 |
| 2014 | $1,816 | $34,720 | $10,940 | $23,780 |
| 2013 | $1,813 | $41,540 | $12,770 | $28,770 |
Source: Public Records
Map
Nearby Homes
- 4752 E Lower Springboro Rd
- 401 Wilkerson Ln
- 5669 O Neall Rd
- 0 Ohio 73 Unit 944080
- Tract 2 O'Neall Rd
- Tract 3 O'Neall Rd
- 196 S 3rd St
- 155 S Main St
- 460 Miami St
- 1 Cumberland Ct
- 53 S 4th St
- 26 Country Lakes Blvd
- 20 Country Lakes Blvd
- 10 Country Lakes Blvd
- 4 Corwin Rd
- 6363 Trillium Dr
- 0 Trillium Dr Unit 943456
- 127 New Burlington Rd
- 1106 Brookfield Dr Unit 1106
- 350 Somerset Ln
- 5759 S Cincinnati-Columbus Rd
- 5733 Cincinnati Columbus Rd S
- 5812 Cincinnati Columbus Rd S
- 5707 Cincinnati Columbus Rd S
- 5664 Cincinnati Columbus Rd S
- 4751 E Lower Springboro Rd
- 5147 E Lower Springboro Rd
- 5660 Cincinnati Columbus Rd S
- 5903 Cincinnati Columbus Rd S
- 3792 U S Highway 42
- 5108 E Lower Springboro Rd
- 5607 Cincinnati Columbus Rd S
- 3841 Waynesville Rd
- 4852 E Lower Springboro Rd
- 5719 N Waynesville Rd
- 5665 N Waynesville Rd
- 5663 N Waynesville Rd
- 5593 N Waynesville Rd
- 5600 N Waynesville Rd
- 4701 E Lower Springboro Rd