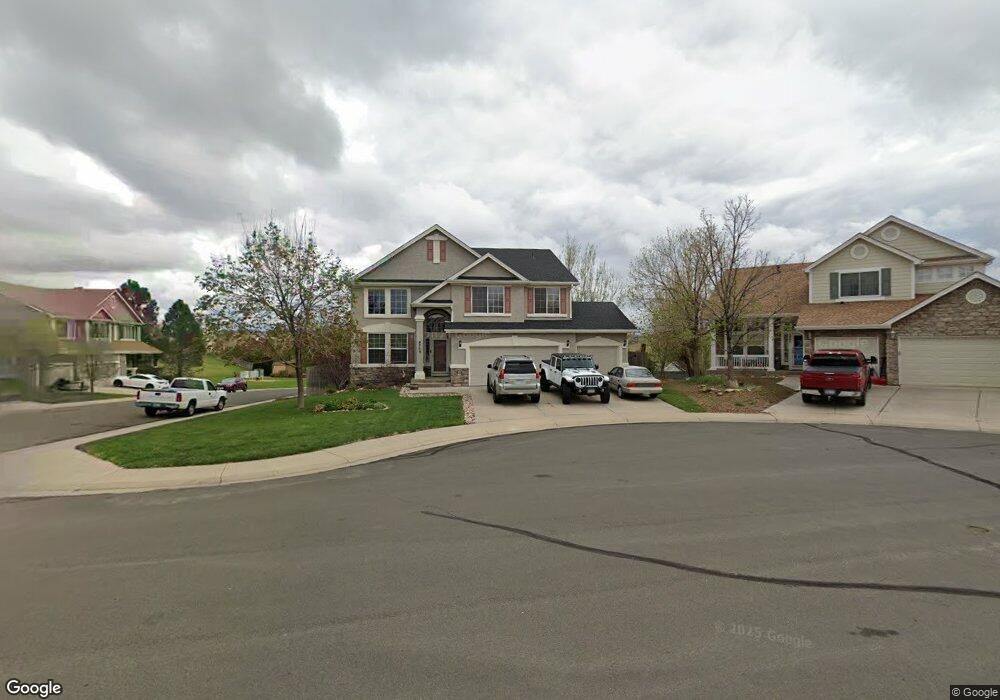
5759 S Sicily St Aurora, CO 80015
Saddle Rock Ridge NeighborhoodEstimated Value: $639,482 - $724,000
3
Beds
3
Baths
3,116
Sq Ft
$217/Sq Ft
Est. Value
About This Home
This home is located at 5759 S Sicily St, Aurora, CO 80015 and is currently estimated at $676,621, approximately $217 per square foot. 5759 S Sicily St is a home located in Arapahoe County with nearby schools including Antelope Ridge Elementary School, Thunder Ridge Middle School, and Eaglecrest High School.
Ownership History
Date
Name
Owned For
Owner Type
Purchase Details
Closed on
May 20, 2016
Sold by
Fulton Danny L
Bought by
Fulton Danny L and Fulton Kara S
Current Estimated Value
Purchase Details
Closed on
Aug 8, 2011
Sold by
Secretary Of Housing & Urban Development
Bought by
Fulton Danny L
Home Financials for this Owner
Home Financials are based on the most recent Mortgage that was taken out on this home.
Original Mortgage
$242,819
Outstanding Balance
$167,733
Interest Rate
4.52%
Mortgage Type
New Conventional
Estimated Equity
$508,888
Purchase Details
Closed on
May 16, 2011
Sold by
Kamran Zahid and Wells Fargo Bank Na
Bought by
The Secretary Of Housing & Urban Develop
Purchase Details
Closed on
Jun 8, 2000
Sold by
Engle Homes Colorado Inc
Bought by
Kamran Zahid
Home Financials for this Owner
Home Financials are based on the most recent Mortgage that was taken out on this home.
Original Mortgage
$214,300
Interest Rate
9%
Create a Home Valuation Report for This Property
The Home Valuation Report is an in-depth analysis detailing your home's value as well as a comparison with similar homes in the area
Home Values in the Area
Average Home Value in this Area
Purchase History
| Date | Buyer | Sale Price | Title Company |
|---|---|---|---|
| Fulton Danny L | -- | None Available | |
| Fulton Danny L | $255,599 | Ats | |
| The Secretary Of Housing & Urban Develop | $363,450 | None Available | |
| Kamran Zahid | $268,000 | Universal Land Title |
Source: Public Records
Mortgage History
| Date | Status | Borrower | Loan Amount |
|---|---|---|---|
| Open | Fulton Danny L | $242,819 | |
| Previous Owner | Kamran Zahid | $214,300 | |
| Closed | Kamran Zahid | $53,700 |
Source: Public Records
Tax History Compared to Growth
Tax History
| Year | Tax Paid | Tax Assessment Tax Assessment Total Assessment is a certain percentage of the fair market value that is determined by local assessors to be the total taxable value of land and additions on the property. | Land | Improvement |
|---|---|---|---|---|
| 2024 | $4,324 | $41,801 | -- | -- |
| 2023 | $4,324 | $41,801 | $0 | $0 |
| 2022 | $3,948 | $34,173 | $0 | $0 |
| 2021 | $3,978 | $34,173 | $0 | $0 |
| 2020 | $3,666 | $32,111 | $0 | $0 |
| 2019 | $3,557 | $32,111 | $0 | $0 |
| 2018 | $3,458 | $28,375 | $0 | $0 |
| 2017 | $3,408 | $28,375 | $0 | $0 |
| 2016 | $3,429 | $27,311 | $0 | $0 |
| 2015 | $3,326 | $27,311 | $0 | $0 |
| 2014 | -- | $20,457 | $0 | $0 |
| 2013 | -- | $22,120 | $0 | $0 |
Source: Public Records
Map
Nearby Homes
- 22379 E Dorado Ave
- 22192 E Alamo Ln
- 5904 S Ukraine St
- 5593 S Valdai Way
- 5555 S Rome St
- 23032 E Alamo Place
- 5932 S Versailles St
- 5973 S Wenatchee St
- 5755 S Zante Cir
- 5745 S Quatar Ct
- 5466 S Shawnee Way
- 5491 S Versailles St
- 5810 S Perth Place
- 5839 S Perth Place
- 6018 S Winnipeg St
- 5901 S Perth St
- 23201 E Orchard Place
- 5773 S Orleans St
- 5440 S Versailles Way
- 5758 S Zante Way
- 5749 S Sicily St
- 5779 S Sicily St
- 5750 S Sicily St
- 5760 S Sicily St
- 5740 S Sicily St
- 5789 S Sicily St
- 5739 S Sicily St
- 22253 E Ida Place
- 5730 S Sicily St
- 22245 E Ida Place
- 5719 S Sicily St
- 22255 E Ida Place
- 5729 S Sicily St
- 22243 E Ida Place
- 22273 E Ida Place
- 5720 S Sicily St
- 22225 E Ida Place
- 22275 E Ida Place
- 5710 S Sicily St
- 22301 E Dorado Dr