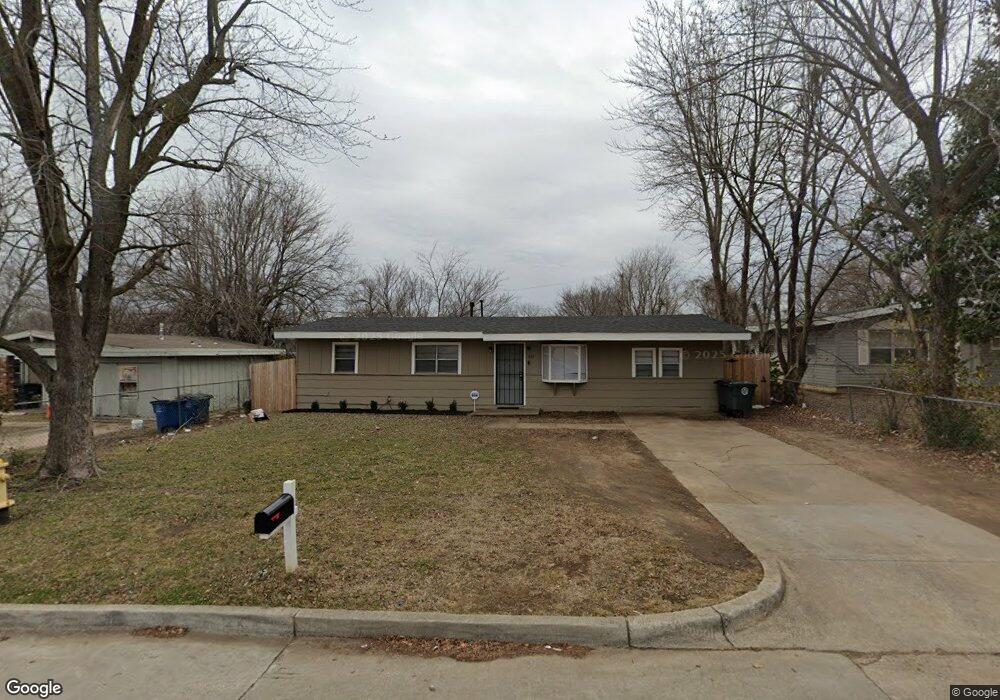
576 E 55th Place N Tulsa, OK 74126
Chamberlain NeighborhoodEstimated Value: $124,000 - $143,140
Studio
1
Bath
1,200
Sq Ft
$110/Sq Ft
Est. Value
About This Home
This home is located at 576 E 55th Place N, Tulsa, OK 74126 and is currently estimated at $132,535, approximately $110 per square foot. 576 E 55th Place N is a home located in Tulsa County with nearby schools including Monroe Demonstration Academy, McLain High School of Science and Technology, and Tulsa Legacy Charter School.
Ownership History
Date
Name
Owned For
Owner Type
Purchase Details
Closed on
Sep 19, 2024
Sold by
Rei Nation Llc
Bought by
Agarwal & Thakur Family Trust and Thakur
Current Estimated Value
Home Financials for this Owner
Home Financials are based on the most recent Mortgage that was taken out on this home.
Original Mortgage
$100,500
Outstanding Balance
$99,175
Interest Rate
6.47%
Mortgage Type
New Conventional
Estimated Equity
$33,360
Purchase Details
Closed on
Feb 14, 2024
Sold by
Ogle Property Solutions Llc
Bought by
Rei Nation Llc
Purchase Details
Closed on
Jan 11, 2024
Sold by
Gaffney Timothy A
Bought by
Ogle Property Solutions Llc
Purchase Details
Closed on
Oct 22, 2019
Sold by
Cook Shera M
Bought by
Gaffney Timothy A
Purchase Details
Closed on
Aug 1, 1995
Purchase Details
Closed on
Aug 1, 1989
Create a Home Valuation Report for This Property
The Home Valuation Report is an in-depth analysis detailing your home's value as well as a comparison with similar homes in the area
Home Values in the Area
Average Home Value in this Area
Purchase History
| Date | Buyer | Sale Price | Title Company |
|---|---|---|---|
| Agarwal & Thakur Family Trust | $140,000 | Iron Title Insurance Agency | |
| Rei Nation Llc | $61,000 | Closed Llc | |
| Ogle Property Solutions Llc | $51,000 | Closed Llc | |
| Gaffney Timothy A | -- | Closed Llc | |
| Gaffney Timothy A | $20,000 | None Available | |
| -- | $25,000 | -- | |
| -- | $10,500 | -- |
Source: Public Records
Mortgage History
| Date | Status | Borrower | Loan Amount |
|---|---|---|---|
| Open | Agarwal & Thakur Family Trust | $100,500 |
Source: Public Records
Tax History
| Year | Tax Paid | Tax Assessment Tax Assessment Total Assessment is a certain percentage of the fair market value that is determined by local assessors to be the total taxable value of land and additions on the property. | Land | Improvement |
|---|---|---|---|---|
| 2025 | $2,064 | $15,400 | $979 | $14,421 |
| 2024 | $397 | $3,287 | $751 | $2,536 |
| 2023 | $397 | $3,130 | $894 | $2,236 |
| 2022 | $397 | $2,981 | $979 | $2,002 |
| 2021 | $394 | $2,981 | $979 | $2,002 |
| 2020 | $388 | $2,981 | $979 | $2,002 |
| 2019 | $347 | $2,531 | $702 | $1,829 |
| 2018 | $348 | $2,531 | $702 | $1,829 |
| 2017 | $347 | $3,531 | $979 | $2,552 |
| 2016 | $340 | $3,531 | $979 | $2,552 |
| 2015 | $340 | $3,531 | $979 | $2,552 |
| 2014 | $337 | $3,531 | $979 | $2,552 |
Source: Public Records
Map
Nearby Homes
- 552 E 55th Place N
- 5439 N Frankfort Ave
- 5462 N Hartford Ave
- 5512 N Hartford Place
- 414 E 54th St N
- 658 E 53rd St N
- 274 E 53rd St N
- 5462 N Johnstown Ave
- 241 E 53rd St N
- 557 E 59th St N
- 5234 N Kenosha Ave
- 223 E 52nd St N
- 5806 N Madison Ave
- 1027 E 56th St N
- 0 N Cincinnati Place
- 554 E 48th Place N
- 10 E 50th Place N
- 5635 N Peoria Ave
- 4842 N Johnstown Ave
- 4670 N Hartford Ave
- 572 E 55th Place N
- 606 E 55th Place N
- 610 E 55th Place N
- 562 E 55th Place N
- 616 E 55th Place N
- 543 E 55th St N
- 5511 N Garrison Ave
- 5512 N Garrison Ave
- 609 E 55th Place N
- 603 607 & 611 E 55th St N
- 558 E 55th Place N
- 541 E 55th St N
- 619 E 55th St N
- 563 E 55th Place N
- 618 E 55th Place N
- 615 E 55th Place N
- 559 E 55th Place N
- 623 E 55th St N
- 537 E 55th St N
- 619 E 55th Place N
Your Personal Tour Guide
Ask me questions while you tour the home.