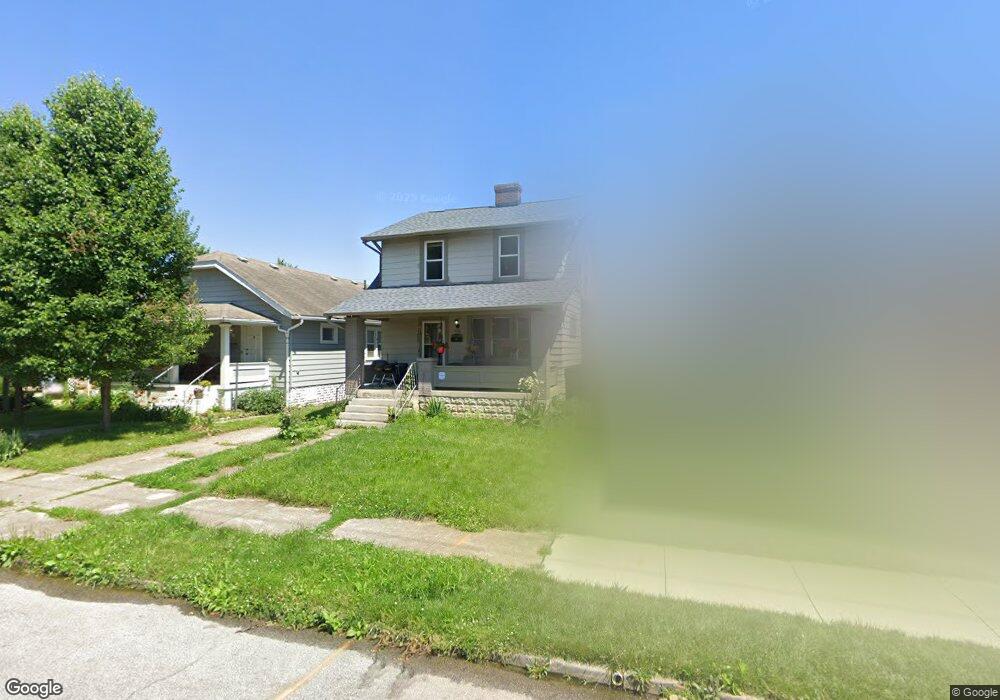
576 E Moler St Columbus, OH 43207
Vassor Village NeighborhoodEstimated Value: $169,000 - $186,000
2
Beds
1
Bath
1,064
Sq Ft
$164/Sq Ft
Est. Value
About This Home
This home is located at 576 E Moler St, Columbus, OH 43207 and is currently estimated at $174,679, approximately $164 per square foot. 576 E Moler St is a home located in Franklin County with nearby schools including Lincoln Park Elementary School, South High School, and South Columbus Preparatory Academy.
Ownership History
Date
Name
Owned For
Owner Type
Purchase Details
Closed on
Sep 25, 2014
Sold by
Holden Aaron
Bought by
Ammar Mohammed Ghiath
Current Estimated Value
Purchase Details
Closed on
May 17, 2005
Sold by
Liskany Lynn
Bought by
Holden Aaron
Home Financials for this Owner
Home Financials are based on the most recent Mortgage that was taken out on this home.
Original Mortgage
$74,000
Interest Rate
6.4%
Mortgage Type
Fannie Mae Freddie Mac
Purchase Details
Closed on
Nov 12, 2004
Sold by
Gartin Jonda
Bought by
Liskany Janos and Liskany Lynn
Purchase Details
Closed on
Apr 19, 1995
Sold by
Kendall John G
Bought by
Jonda Gartin
Home Financials for this Owner
Home Financials are based on the most recent Mortgage that was taken out on this home.
Original Mortgage
$31,400
Interest Rate
8.64%
Mortgage Type
FHA
Purchase Details
Closed on
Aug 24, 1993
Purchase Details
Closed on
Dec 1, 1985
Create a Home Valuation Report for This Property
The Home Valuation Report is an in-depth analysis detailing your home's value as well as a comparison with similar homes in the area
Home Values in the Area
Average Home Value in this Area
Purchase History
| Date | Buyer | Sale Price | Title Company |
|---|---|---|---|
| Ammar Mohammed Ghiath | $15,606 | None Available | |
| Holden Aaron | $92,500 | Titlevisio | |
| Liskany Janos | $44,000 | Chicago Tit | |
| Jonda Gartin | $31,500 | -- | |
| -- | -- | -- | |
| -- | -- | -- |
Source: Public Records
Mortgage History
| Date | Status | Borrower | Loan Amount |
|---|---|---|---|
| Previous Owner | Holden Aaron | $74,000 | |
| Previous Owner | Jonda Gartin | $31,400 | |
| Closed | Holden Aaron | $18,500 |
Source: Public Records
Tax History
| Year | Tax Paid | Tax Assessment Tax Assessment Total Assessment is a certain percentage of the fair market value that is determined by local assessors to be the total taxable value of land and additions on the property. | Land | Improvement |
|---|---|---|---|---|
| 2025 | $2,244 | $38,510 | $18,170 | $20,340 |
| 2024 | $2,244 | $48,970 | $18,170 | $30,800 |
| 2023 | $2,216 | $48,965 | $18,165 | $30,800 |
| 2022 | $1,094 | $20,590 | $4,520 | $16,070 |
| 2021 | $1,096 | $20,590 | $4,520 | $16,070 |
| 2020 | $1,098 | $20,590 | $4,520 | $16,070 |
| 2019 | $1,017 | $16,350 | $3,780 | $12,570 |
| 2018 | $507 | $16,350 | $3,780 | $12,570 |
| 2017 | $1,016 | $16,350 | $3,780 | $12,570 |
| 2016 | $951 | $14,000 | $3,500 | $10,500 |
| 2015 | $433 | $14,000 | $3,500 | $10,500 |
| 2014 | $1,085 | $17,500 | $3,500 | $14,000 |
| 2013 | $958 | $18,410 | $3,675 | $14,735 |
Source: Public Records
Map
Nearby Homes
- 676 E Moler St
- 523 Hanford St
- 704 Hanford St
- 610 Southwood Ave
- 573 E Mithoff St
- 513 E Jenkins Ave
- 601 Southwood Ave
- 605 Southwood Ave
- 650 E Mithoff St
- 515 E Mithoff St
- 693 Thurman Ave
- 1263 Heyl Ave
- 524 Thurman Ave
- 0 Gilbert St
- 423 Sheldon Ave
- 539 Thurman Ave
- 415 Sheldon Ave
- 1178 Wager St
- 498 Thurman Ave
- 798 E Mithoff St
- 580 E Moler St
- 572 E Moler St
- 584 E Moler St
- 568 E Moler St
- 564 E Moler St
- 558 E Moler St
- 583 Frebis Ave
- 569 Frebis Ave
- 587 Frebis Ave Unit 591
- 575 E Moler St
- 554 E Moler St
- 571 E Moler St
- 591 Frebis Ave
- 600 E Moler St
- 585 E Moler St
- 559 Frebis Ave
- 604 E Moler St
- 555 Frebis Ave
- 555 E Moler St
- 601 Frebis Ave
Your Personal Tour Guide
Ask me questions while you tour the home.