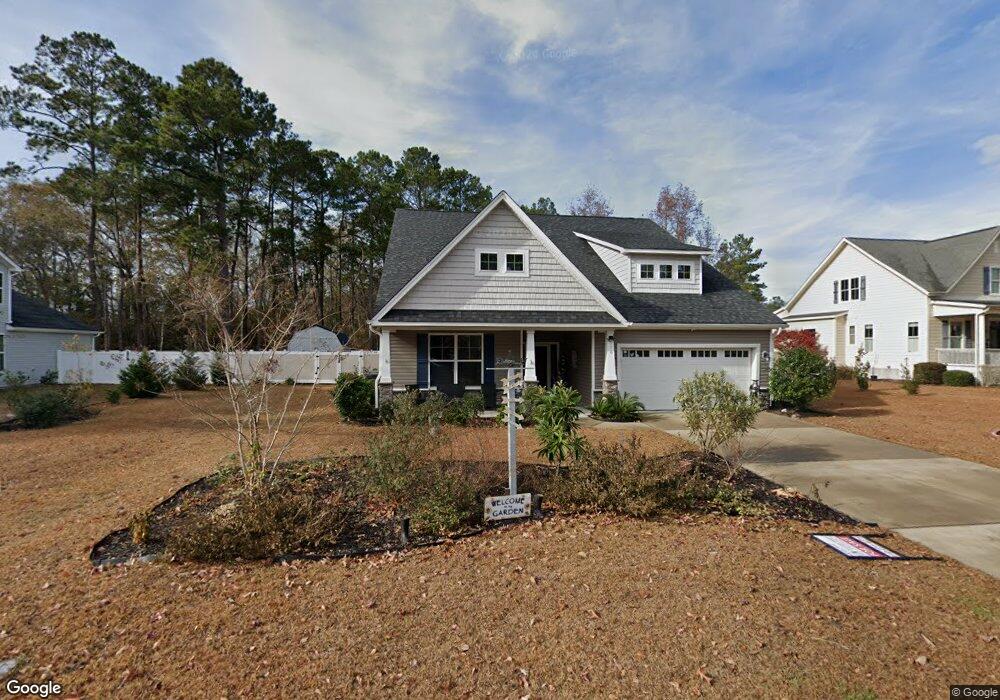
576 Eden Dr SW Unit 36483717 Supply, NC 28462
Estimated Value: $570,640 - $651,000
4
Beds
3
Baths
2,532
Sq Ft
$241/Sq Ft
Est. Value
About This Home
This home is located at 576 Eden Dr SW Unit 36483717, Supply, NC 28462 and is currently estimated at $609,660, approximately $240 per square foot. 576 Eden Dr SW Unit 36483717 is a home located in Brunswick County with nearby schools including Virginia Williamson Elementary School, Cedar Grove Middle School, and West Brunswick High School.
Ownership History
Date
Name
Owned For
Owner Type
Purchase Details
Closed on
Aug 23, 2022
Sold by
Wilkinson Donald A and Wilkinson Angela W
Bought by
Ianelli Paul and Ianelli Ellen
Current Estimated Value
Home Financials for this Owner
Home Financials are based on the most recent Mortgage that was taken out on this home.
Original Mortgage
$388,800
Outstanding Balance
$329,424
Interest Rate
4.67%
Mortgage Type
New Conventional
Estimated Equity
$280,236
Purchase Details
Closed on
Jan 14, 2021
Sold by
Windsor Investments Llc
Bought by
Wilksinson Donald A and Wilkinson Angela G
Purchase Details
Closed on
Jan 1, 2021
Sold by
Windsor Homes
Bought by
Wilksinson Donald A and Wilksinson Angela G
Purchase Details
Closed on
Sep 6, 2018
Sold by
Ruffins River Land Holding Llc
Bought by
Windsor Investments Llc
Purchase Details
Closed on
Oct 14, 2014
Sold by
High Point Bank And Trust Co
Bought by
Ruffins River Land Holding Llc
Create a Home Valuation Report for This Property
The Home Valuation Report is an in-depth analysis detailing your home's value as well as a comparison with similar homes in the area
Home Values in the Area
Average Home Value in this Area
Purchase History
| Date | Buyer | Sale Price | Title Company |
|---|---|---|---|
| Ianelli Paul | $560,000 | Johnson Ryan W | |
| Ianelli Paul | $560,000 | Johnson Ryan W | |
| Wilksinson Donald A | $325,000 | None Available | |
| Wilksinson Donald A | $325,000 | Miller Anna B | |
| Windsor Investments Llc | $256,000 | None Available | |
| Ruffins River Land Holding Llc | $225,000 | None Available |
Source: Public Records
Mortgage History
| Date | Status | Borrower | Loan Amount |
|---|---|---|---|
| Open | Ianelli Paul | $388,800 | |
| Closed | Ianelli Paul | $388,800 | |
| Closed | Windsor Investments Llc | $0 |
Source: Public Records
Tax History Compared to Growth
Tax History
| Year | Tax Paid | Tax Assessment Tax Assessment Total Assessment is a certain percentage of the fair market value that is determined by local assessors to be the total taxable value of land and additions on the property. | Land | Improvement |
|---|---|---|---|---|
| 2025 | $2,211 | $529,590 | $43,000 | $486,590 |
| 2024 | $2,211 | $529,590 | $43,000 | $486,590 |
| 2023 | $2,116 | $463,230 | $43,000 | $420,230 |
| 2022 | $1,916 | $353,790 | $36,000 | $317,790 |
| 2021 | $1,916 | $312,510 | $36,000 | $276,510 |
| 2020 | $1,916 | $312,510 | $36,000 | $276,510 |
| 2019 | $191 | $36,000 | $36,000 | $0 |
| 2018 | $66 | $11,000 | $11,000 | $0 |
| 2017 | $66 | $11,000 | $11,000 | $0 |
| 2016 | $63 | $11,000 | $11,000 | $0 |
| 2015 | $63 | $11,000 | $11,000 | $0 |
| 2014 | $320 | $70,000 | $70,000 | $0 |
Source: Public Records
Map
Nearby Homes
- Midland 2 Plan at Ruffins River Landing
- Cotswold 3 Plan at Ruffins River Landing
- Bailey Plan at Ruffins River Landing
- Pembroke 3 Plan at Ruffins River Landing
- Cameron Plan at Ruffins River Landing
- Somerset 3 Plan at Ruffins River Landing
- Stoddard Plan at Ruffins River Landing
- Southport Plan at Ruffins River Landing
- Richmond Plan at Ruffins River Landing
- Seagrove Plan at Ruffins River Landing
- Lexington Plan at Ruffins River Landing
- 831 Treasure Cove Ln SW
- 919 Billys Dream Cir SW
- 1024 SW Maple View Rd
- 976 Billys Dream Cir SW
- 888 Billys Dream Cir SW
- 846 Compass Rose Ln
- 483 Sea Captain Ln
- 788 Compass Rose Ln
- 437 Eden Dr SW
- 576 Eden Dr SW Unit 36488549
- 576 Eden Dr SW Unit 36449060
- 576 Eden Dr SW Unit 36503662
- 576 Eden Dr SW Unit 36485968
- 576 Eden Dr SW Unit 36461193
- 576 Eden Dr SW Unit 36477821
- 576 Eden Dr SW Unit 36496594
- 576 Eden Dr SW Unit 36490926
- 576 Eden Dr SW Unit 36434721
- 576 Eden Dr SW Unit 36481733
- 576 Eden Dr SW Unit 36495794
- 505 Eden Dr SW
- 0 Call for Appointment Unit 1781087
- 568 Eden Dr SW
- 823 Treasure Cove SW
- 571 Eden Dr SW
- 484 Eden Dr SW
- 331 Eden Dr SW
- 588 Eden Dr SW
- 469 Eden Dr SW