Estimated Value: $170,000 - $199,689
4
Beds
1
Bath
1,470
Sq Ft
$128/Sq Ft
Est. Value
About This Home
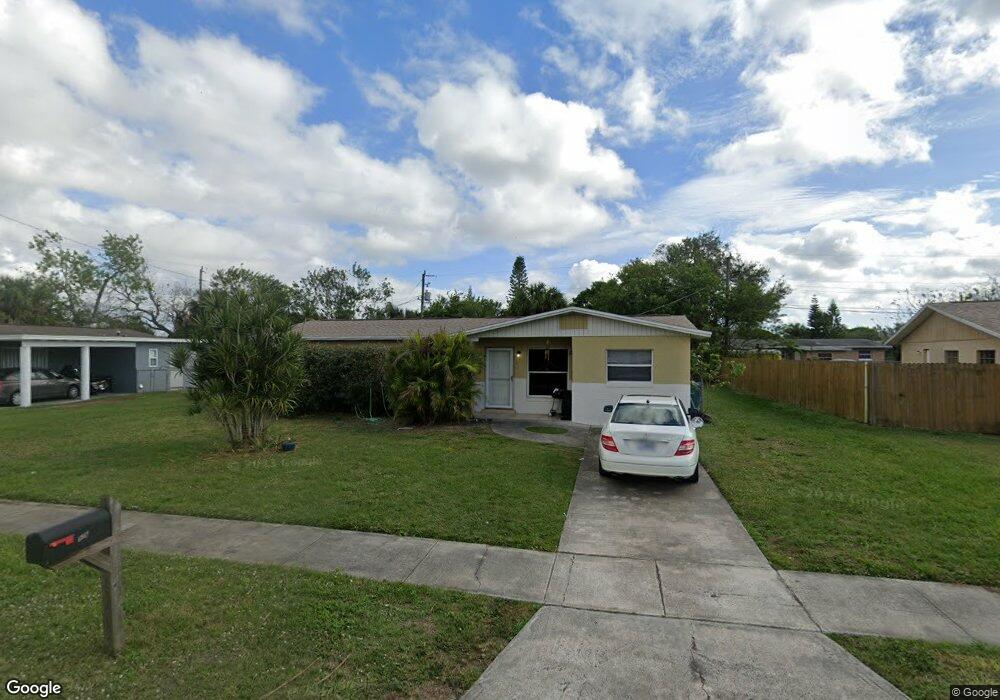
This home is located at 576 Grant St, Cocoa, FL 32926 and is currently estimated at $188,422, approximately $128 per square foot. 576 Grant St is a home located in Brevard County with nearby schools including Saturn Elementary School, Ronald McNair Magnet Middle School, and Rockledge Senior High School.
Ownership History
Date
Name
Owned For
Owner Type
Purchase Details
Closed on
Sep 20, 2017
Sold by
Edwards James and Edwards James
Bought by
Golden Tulip Holding Corp
Current Estimated Value
Purchase Details
Closed on
Jun 18, 2009
Sold by
Sherman Felix
Bought by
Edwards James and Edwards Kathleen
Purchase Details
Closed on
Jun 17, 2009
Sold by
Hamilton Billy
Bought by
Edwards James and Edwards Kathleen
Create a Home Valuation Report for This Property
The Home Valuation Report is an in-depth analysis detailing your home's value as well as a comparison with similar homes in the area
Home Values in the Area
Average Home Value in this Area
Purchase History
| Date | Buyer | Sale Price | Title Company |
|---|---|---|---|
| Golden Tulip Holding Corp | -- | Landing Title Agency Inc | |
| Golden Tulip Holding Corp | $48,000 | Landing Title Agency Inc | |
| Edwards James | $45,000 | State Title Partners Llp | |
| Edwards James | -- | State Title Partners Llp | |
| Edwards James | -- | State Title Partners Llp |
Source: Public Records
Tax History Compared to Growth
Tax History
| Year | Tax Paid | Tax Assessment Tax Assessment Total Assessment is a certain percentage of the fair market value that is determined by local assessors to be the total taxable value of land and additions on the property. | Land | Improvement |
|---|---|---|---|---|
| 2025 | $1,877 | $130,630 | -- | -- |
| 2024 | $1,381 | $143,430 | -- | -- |
| 2023 | $1,381 | $69,760 | $0 | $0 |
| 2022 | $1,235 | $58,930 | $0 | $0 |
| 2021 | $564 | $42,700 | $10,000 | $32,700 |
| 2020 | $1,100 | $43,370 | $10,000 | $33,370 |
| 2019 | $1,055 | $42,920 | $10,000 | $32,920 |
| 2018 | $1,082 | $44,040 | $9,000 | $35,040 |
| 2017 | $1,071 | $46,740 | $9,000 | $37,740 |
| 2016 | $1,046 | $44,390 | $9,000 | $35,390 |
| 2015 | $602 | $35,840 | $9,000 | $26,840 |
| 2014 | $538 | $32,590 | $9,000 | $23,590 |
Source: Public Records
Map
Nearby Homes