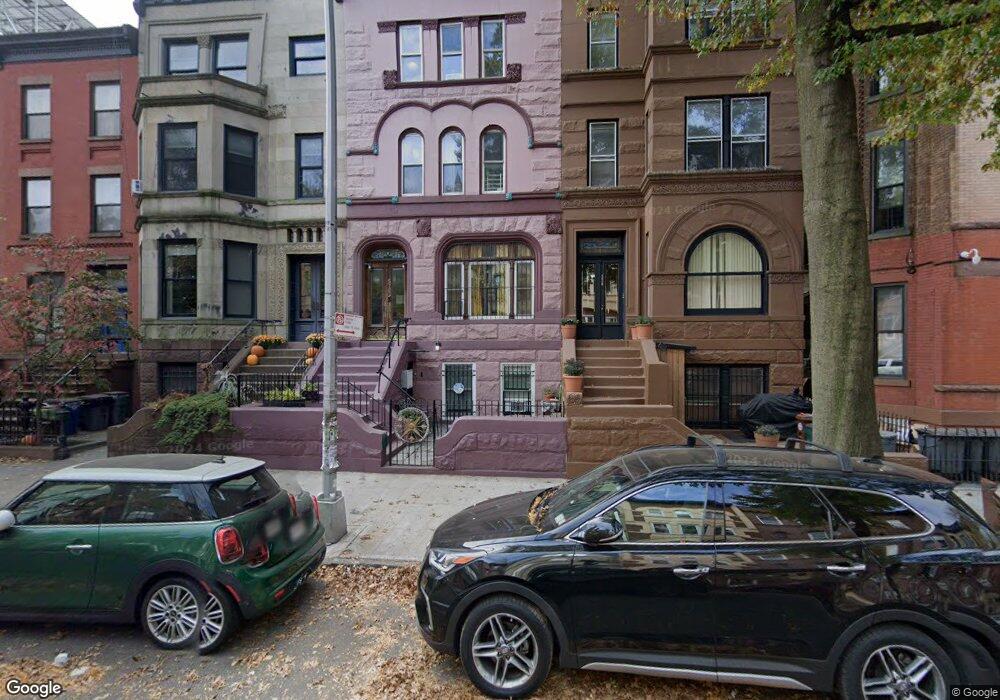
576 Jefferson Ave Unit 2 Brooklyn, NY 11221
Bed-Stuy NeighborhoodEstimated Value: $1,862,000 - $2,319,000
2
Beds
--
Bath
3,528
Sq Ft
$595/Sq Ft
Est. Value
About This Home
This home is located at 576 Jefferson Ave Unit 2, Brooklyn, NY 11221 and is currently estimated at $2,100,333, approximately $595 per square foot. 576 Jefferson Ave Unit 2 is a home located in Kings County with nearby schools including P.S. 262 El Hajj Malik El Shabazz Elementary School, La Cima Charter School, and The Co-Op School.
Ownership History
Date
Name
Owned For
Owner Type
Purchase Details
Closed on
Dec 8, 2001
Sold by
Advance Local Development Corp
Bought by
Titte Donna
Current Estimated Value
Purchase Details
Closed on
May 27, 1999
Sold by
No Exit Place Realty
Bought by
Advance Local Development Corp
Home Financials for this Owner
Home Financials are based on the most recent Mortgage that was taken out on this home.
Original Mortgage
$315,000
Interest Rate
7.77%
Mortgage Type
FHA
Purchase Details
Closed on
Feb 11, 1998
Sold by
Gilmer Andree
Bought by
Cabs Nursing Home Co Inc
Purchase Details
Closed on
Jun 15, 1996
Sold by
Webb Ethel Bryant
Bought by
Gilmer Andree
Create a Home Valuation Report for This Property
The Home Valuation Report is an in-depth analysis detailing your home's value as well as a comparison with similar homes in the area
Home Values in the Area
Average Home Value in this Area
Purchase History
| Date | Buyer | Sale Price | Title Company |
|---|---|---|---|
| Titte Donna | -- | -- | |
| Titte Donna | -- | -- | |
| Advance Local Development Corp | $278,000 | Stewart Title Insurance Co | |
| No Exit Place Realty Corp | $150,000 | Stewart Title Insurance Co | |
| No Exit Place Realty Corp | $150,000 | Stewart Title Insurance Co | |
| Cabs Nursing Home Co Inc | -- | -- | |
| Cabs Nursing Home Co Inc | -- | -- | |
| Gilmer Andree | -- | -- | |
| Gilmer Andree | -- | -- |
Source: Public Records
Mortgage History
| Date | Status | Borrower | Loan Amount |
|---|---|---|---|
| Previous Owner | No Exit Place Realty Corp | $315,000 |
Source: Public Records
Tax History Compared to Growth
Tax History
| Year | Tax Paid | Tax Assessment Tax Assessment Total Assessment is a certain percentage of the fair market value that is determined by local assessors to be the total taxable value of land and additions on the property. | Land | Improvement |
|---|---|---|---|---|
| 2025 | $7,081 | $134,460 | $20,940 | $113,520 |
| 2024 | $7,081 | $123,360 | $20,940 | $102,420 |
| 2023 | $7,101 | $137,820 | $20,940 | $116,880 |
| 2022 | $6,587 | $120,900 | $20,940 | $99,960 |
| 2021 | $6,552 | $105,780 | $20,940 | $84,840 |
| 2020 | $3,255 | $111,840 | $20,940 | $90,900 |
| 2019 | $6,146 | $101,880 | $20,940 | $80,940 |
| 2018 | $5,940 | $29,139 | $8,670 | $20,469 |
| 2017 | $5,605 | $27,498 | $6,600 | $20,898 |
| 2016 | $5,187 | $25,945 | $8,407 | $17,538 |
| 2015 | $1,210 | $25,924 | $12,605 | $13,319 |
| 2014 | $1,210 | $24,482 | $14,284 | $10,198 |
Source: Public Records
Map
Nearby Homes
- 577 Jefferson Ave
- 579 Jefferson Ave Unit 2
- 667 Putnam Ave Unit 1
- 493 Hancock St
- 621 Putnam Ave
- 610 Madison St
- 479 Hancock St
- 614 Madison St
- 476 Hancock St Unit 3
- 560 Hancock St
- 626 Madison St
- 254 Stuyvesant Ave
- 495 Halsey St
- 532 Monroe St Unit TH
- 0 Monroe St Unit KEYH6299681
- 524 Halsey St Unit TH1
- 524 Halsey St Unit 107
- 524 Halsey St Unit 105
- 514 Monroe St
- 521 Monroe St
- 576 Jefferson Ave
- 578 Jefferson Ave
- 574 Jefferson Ave
- 574 Jefferson Ave Unit 2
- 574 Jefferson Ave Unit 4F
- 574 Jefferson Ave Unit 3
- 580 Jefferson Ave
- 582 Jefferson Ave
- 582 Jefferson Ave
- 582 Jefferson Ave
- 319 Lewis Ave
- 319 Lewis Ave Unit 1
- 584 Jefferson Ave
- 584 Jefferson Ave Unit TWNHS
- 317 Lewis Ave
- 321 Lewis Ave
- 321 Lewis Ave Unit 3
- 315 Lewis Ave
- 570 Jefferson Ave Unit 2
- 570 Jefferson Ave Unit 4