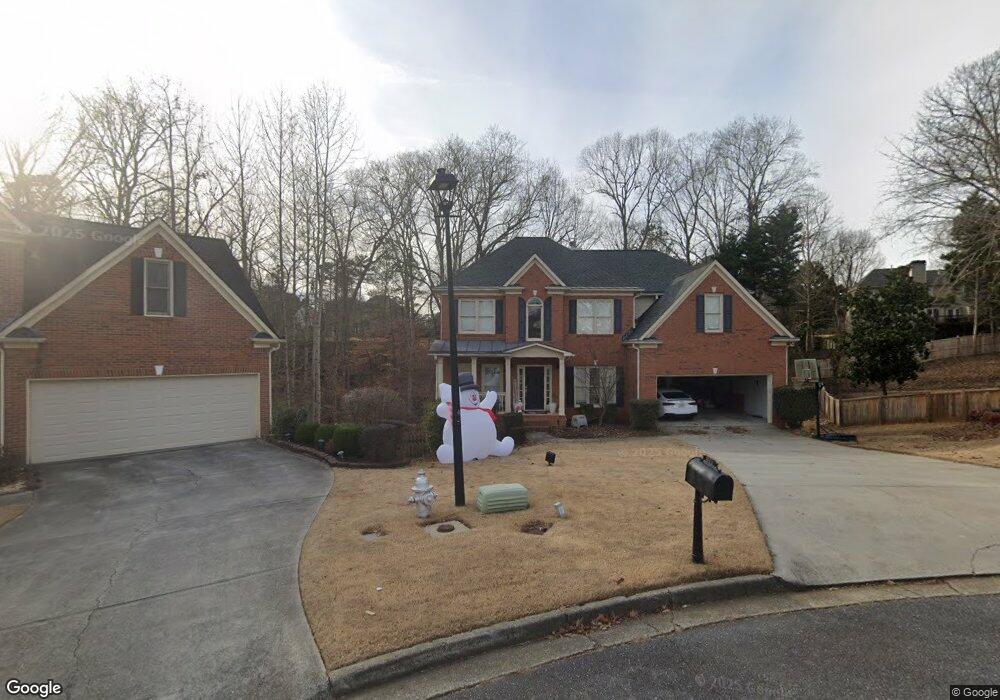
576 Summergrove Ct Unit 2 Suwanee, GA 30024
Estimated Value: $598,000 - $684,000
3
Beds
3
Baths
3,044
Sq Ft
$208/Sq Ft
Est. Value
About This Home
This home is located at 576 Summergrove Ct Unit 2, Suwanee, GA 30024 and is currently estimated at $634,213, approximately $208 per square foot. 576 Summergrove Ct Unit 2 is a home located in Gwinnett County with nearby schools including Suwanee Elementary School, North Gwinnett Middle School, and North Gwinnett High School.
Ownership History
Date
Name
Owned For
Owner Type
Purchase Details
Closed on
Aug 17, 2004
Sold by
Patel Dhiren and Patel Asita
Bought by
Gamble Corey and Gamble Subrina
Current Estimated Value
Home Financials for this Owner
Home Financials are based on the most recent Mortgage that was taken out on this home.
Original Mortgage
$56,000
Interest Rate
5.4%
Mortgage Type
Unknown
Purchase Details
Closed on
Mar 10, 2000
Sold by
Peachtree Residential Properties
Bought by
Patel Dhiren and Patel Asita
Home Financials for this Owner
Home Financials are based on the most recent Mortgage that was taken out on this home.
Original Mortgage
$188,000
Interest Rate
7.5%
Mortgage Type
New Conventional
Create a Home Valuation Report for This Property
The Home Valuation Report is an in-depth analysis detailing your home's value as well as a comparison with similar homes in the area
Home Values in the Area
Average Home Value in this Area
Purchase History
| Date | Buyer | Sale Price | Title Company |
|---|---|---|---|
| Gamble Corey | $280,000 | -- | |
| Patel Dhiren | $235,000 | -- |
Source: Public Records
Mortgage History
| Date | Status | Borrower | Loan Amount |
|---|---|---|---|
| Closed | Gamble Corey | $56,000 | |
| Open | Gamble Corey | $224,000 | |
| Previous Owner | Patel Dhiren | $188,000 |
Source: Public Records
Tax History Compared to Growth
Tax History
| Year | Tax Paid | Tax Assessment Tax Assessment Total Assessment is a certain percentage of the fair market value that is determined by local assessors to be the total taxable value of land and additions on the property. | Land | Improvement |
|---|---|---|---|---|
| 2025 | $7,484 | $290,560 | $44,080 | $246,480 |
| 2024 | $6,949 | $255,320 | $47,200 | $208,120 |
| 2023 | $6,949 | $243,120 | $47,200 | $195,920 |
| 2022 | $6,261 | $223,320 | $40,400 | $182,920 |
| 2021 | $5,116 | $163,360 | $29,720 | $133,640 |
| 2020 | $4,970 | $154,840 | $27,640 | $127,200 |
| 2019 | $4,834 | $154,840 | $27,640 | $127,200 |
| 2018 | $4,552 | $141,320 | $32,000 | $109,320 |
| 2016 | $4,256 | $126,720 | $28,000 | $98,720 |
| 2015 | $3,945 | $110,520 | $21,200 | $89,320 |
| 2014 | -- | $110,520 | $21,200 | $89,320 |
Source: Public Records
Map
Nearby Homes
- 3720 Brookefall Landing
- 358 Rhodes House Ct
- 407 Vista Lake Dr
- 3713 Lake Edge Dr
- 3612 Brookefall Ct
- 3998 Oak Crossing Dr NE
- 3941 Oak Crossing Dr
- 3740 Crescent Walk Ln
- 3720 Crescent Walk Ln
- 4394 Austin Hills Dr Unit 1
- 4244 Austin Hills Dr
- 4614 Austin Hills Dr
- 366 Regal Pines Ct
- 4450 Woodward Walk Ln
- 665 Roxford Ln Unit 3
- 4045 Hillcrest View Ct
- 4071 Woodward Walk Ln
- 4186 Terrace Oaks Ct
- 4154 Hawking Dr
- 586 Summergrove Ct
- 573 Summergrove Ct
- 3665 Old Suwanee Rd
- 3675 Old Suwnaee Unit 6
- 3675 Old Suwanee Rd Unit 6
- 3675 Old Suwanee Rd
- 3675 Old Rd
- 596 Summergrove Ct
- 3685 Old Suwanee Rd
- 3645 Old Suwanee Rd
- 583 Summergrove Ct Unit 2
- 3635 Old Suwanee Rd
- 3870 Summergrove Landing
- 593 Summergrove Ct Unit 2
- 3780 Brookefall Landing Unit 2
- 3695 Old Suwanee Rd
- 3625 Old Suwanee Rd Unit 1
- 3790 Brookefall Landing
- 3790 Brookefall Landing Unit 2
- 0 Summergrove Ct Unit 7124526