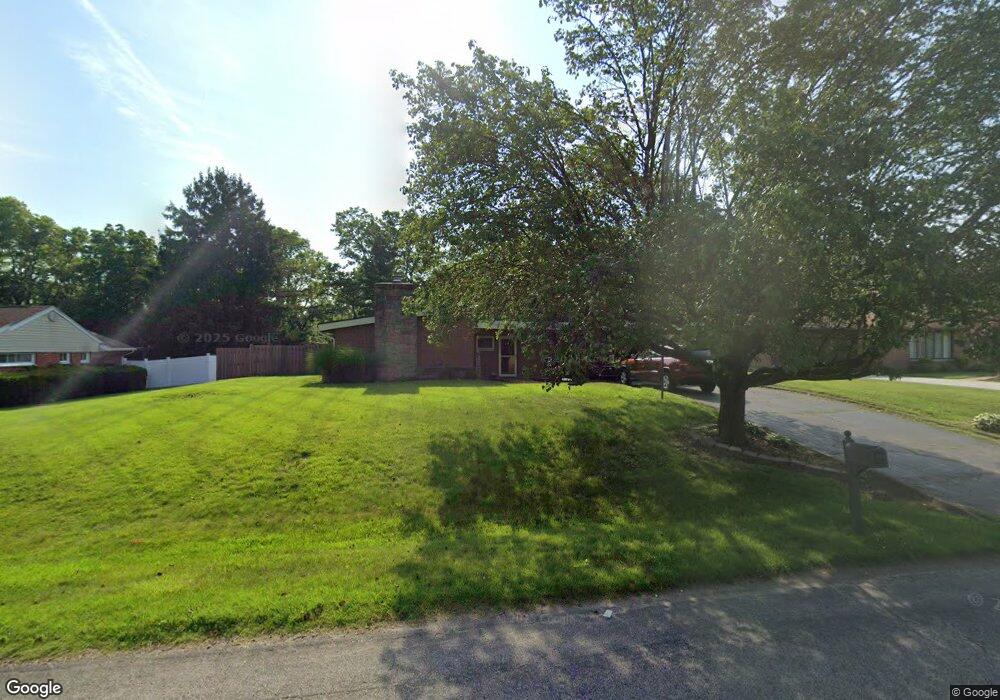
5764 Barbanna Ln Dayton, OH 45415
Estimated Value: $227,966 - $294,000
4
Beds
2
Baths
2,073
Sq Ft
$120/Sq Ft
Est. Value
About This Home
This home is located at 5764 Barbanna Ln, Dayton, OH 45415 and is currently estimated at $247,742, approximately $119 per square foot. 5764 Barbanna Ln is a home located in Montgomery County with nearby schools including Valerie Elementary School, Imagine Schools - Woodbury Academy, and Horizon Science Academy-Dayton Elementary School.
Ownership History
Date
Name
Owned For
Owner Type
Purchase Details
Closed on
Jul 30, 2009
Sold by
Vazquez Juan Carlos Rios and Rios Amy
Bought by
Allen John A
Current Estimated Value
Purchase Details
Closed on
Mar 29, 2002
Sold by
Thomas Nancy L and Lee Nancy
Bought by
Vazquez Juan Carlos Rios
Home Financials for this Owner
Home Financials are based on the most recent Mortgage that was taken out on this home.
Original Mortgage
$111,700
Interest Rate
6.87%
Mortgage Type
FHA
Purchase Details
Closed on
Oct 16, 1998
Sold by
Miller William H
Bought by
Thomas Nancy L and Miller Nancy Lee Thomas
Home Financials for this Owner
Home Financials are based on the most recent Mortgage that was taken out on this home.
Original Mortgage
$93,500
Interest Rate
6.88%
Purchase Details
Closed on
Feb 23, 1994
Sold by
Motter Douglas and Motter Pamela S
Bought by
Mobley Todd A
Create a Home Valuation Report for This Property
The Home Valuation Report is an in-depth analysis detailing your home's value as well as a comparison with similar homes in the area
Home Values in the Area
Average Home Value in this Area
Purchase History
| Date | Buyer | Sale Price | Title Company |
|---|---|---|---|
| Allen John A | $108,000 | Attorney | |
| Vazquez Juan Carlos Rios | $113,500 | -- | |
| Thomas Nancy L | -- | Midwest Abstract Company | |
| Thomas Nancy L | -- | Midwest Abstract Company | |
| Mobley Todd A | -- | -- |
Source: Public Records
Mortgage History
| Date | Status | Borrower | Loan Amount |
|---|---|---|---|
| Previous Owner | Vazquez Juan Carlos Rios | $111,700 | |
| Previous Owner | Thomas Nancy L | $93,500 |
Source: Public Records
Tax History Compared to Growth
Tax History
| Year | Tax Paid | Tax Assessment Tax Assessment Total Assessment is a certain percentage of the fair market value that is determined by local assessors to be the total taxable value of land and additions on the property. | Land | Improvement |
|---|---|---|---|---|
| 2024 | $3,343 | $55,280 | $7,150 | $48,130 |
| 2023 | $3,343 | $55,280 | $7,150 | $48,130 |
| 2022 | $3,091 | $37,870 | $4,900 | $32,970 |
| 2021 | $3,076 | $37,870 | $4,900 | $32,970 |
| 2020 | $3,068 | $37,870 | $4,900 | $32,970 |
| 2019 | $2,711 | $29,890 | $4,900 | $24,990 |
| 2018 | $2,714 | $29,890 | $4,900 | $24,990 |
| 2017 | $2,694 | $29,890 | $4,900 | $24,990 |
| 2016 | $2,567 | $27,210 | $4,900 | $22,310 |
| 2015 | $2,444 | $27,210 | $4,900 | $22,310 |
| 2014 | $2,444 | $27,210 | $4,900 | $22,310 |
| 2012 | -- | $33,070 | $8,160 | $24,910 |
Source: Public Records
Map
Nearby Homes
- 71 Westbrook Rd
- 7725 Harrington Ave
- 7815 N Main St Unit 14
- 0 Springway Dr Unit 927025
- 7851 Volk Dr
- 7935 Harrington Ave
- 161 Ashbrook Rd
- 228 Prospect Ave
- 5025 Basore Rd
- 159 Burgess Ave
- 5326 Greencroft Dr Unit 5324
- 5400 Bromwick Dr
- 4400 Berquist Dr
- 0 Elgin Roof Rd
- 5146 Weddington Dr
- 1555 1557 Shiloh Springs Rd Unit 1555 1557
- 6229 Cheri Lynne Dr
- 8175 Inwood Ave
- 5615 Denlinger Rd
- 6552 Stillcrest Way
- 5782 Barbanna Ln
- 5742 Barbanna Ln
- 5712 Barbanna Ln
- 5804 Barbanna Ln
- 5739 Barbanna Ln
- 5692 Barbanna Ln
- 5824 Barbanna Ln
- 4037 Roman Dr
- 5711 Barbanna Ln
- 4060 Roman Dr
- 5672 Barbanna Ln
- 5823 Barbanna Ln
- 5691 Barbanna Ln
- 5850 Barbanna Ln
- 4074 Roman Dr
- 4073 Roman Dr
- 5671 Barbanna Ln
- 5849 Barbanna Ln
- 5652 Barbanna Ln
- 5724 Algoma St