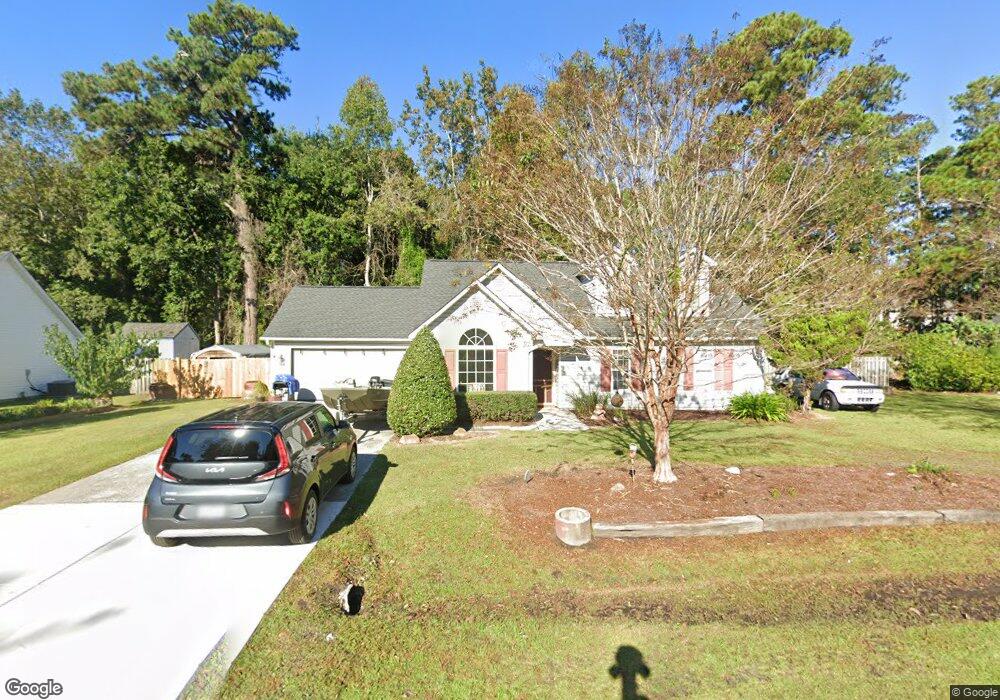
5764 Highgrove Place Wilmington, NC 28409
Estimated Value: $396,025 - $513,000
3
Beds
2
Baths
1,625
Sq Ft
$273/Sq Ft
Est. Value
About This Home
This home is located at 5764 Highgrove Place, Wilmington, NC 28409 and is currently estimated at $444,256, approximately $273 per square foot. 5764 Highgrove Place is a home located in New Hanover County with nearby schools including Heyward C. Bellamy Elementary School, Myrtle Grove Middle School, and Eugene Ashley High School.
Ownership History
Date
Name
Owned For
Owner Type
Purchase Details
Closed on
Mar 16, 2021
Sold by
Corey Dana H and Corey Elizabeth D
Bought by
Corey Dana H and Corey Elizabeth D
Current Estimated Value
Home Financials for this Owner
Home Financials are based on the most recent Mortgage that was taken out on this home.
Original Mortgage
$146,500
Outstanding Balance
$131,327
Interest Rate
2.7%
Mortgage Type
New Conventional
Estimated Equity
$312,929
Purchase Details
Closed on
Jul 16, 2002
Sold by
Sturm Family Trust The
Bought by
Corey Dana H
Purchase Details
Closed on
Nov 14, 2000
Sold by
Sturm Frederick M Tracy
Bought by
Sturm Family Trust The
Purchase Details
Closed on
Nov 16, 1999
Sold by
Lancaster John R Leticia
Bought by
Manly Developments Llc
Purchase Details
Closed on
Dec 20, 1995
Sold by
Jenlyn Enterprises Inc
Bought by
Manly Developments Llc
Create a Home Valuation Report for This Property
The Home Valuation Report is an in-depth analysis detailing your home's value as well as a comparison with similar homes in the area
Home Values in the Area
Average Home Value in this Area
Purchase History
| Date | Buyer | Sale Price | Title Company |
|---|---|---|---|
| Corey Dana H | -- | Accommodation | |
| Corey Dana H | -- | None Listed On Document | |
| Corey Dana H | $125,000 | -- | |
| Sturm Family Trust The | -- | -- | |
| Sturm Frederick M Tracy | $238,000 | -- | |
| Manly Developments Llc | -- | -- | |
| Lancaster John R | -- | -- | |
| Manly Developments Llc | -- | -- |
Source: Public Records
Mortgage History
| Date | Status | Borrower | Loan Amount |
|---|---|---|---|
| Open | Corey Dana H | $146,500 | |
| Closed | Corey Dana H | $146,500 |
Source: Public Records
Tax History Compared to Growth
Tax History
| Year | Tax Paid | Tax Assessment Tax Assessment Total Assessment is a certain percentage of the fair market value that is determined by local assessors to be the total taxable value of land and additions on the property. | Land | Improvement |
|---|---|---|---|---|
| 2025 | $209 | $355,900 | $120,500 | $235,400 |
| 2024 | $209 | $238,000 | $66,900 | $171,100 |
| 2023 | $181 | $238,000 | $66,900 | $171,100 |
| 2022 | $249 | $238,000 | $66,900 | $171,100 |
| 2021 | $361 | $238,000 | $66,900 | $171,100 |
| 2020 | $1,082 | $171,000 | $60,500 | $110,500 |
| 2019 | $1,082 | $171,000 | $60,500 | $110,500 |
| 2018 | $361 | $171,000 | $60,500 | $110,500 |
| 2017 | $1,107 | $171,000 | $60,500 | $110,500 |
| 2016 | $1,064 | $153,500 | $60,500 | $93,000 |
| 2015 | $989 | $153,500 | $60,500 | $93,000 |
| 2014 | $972 | $153,500 | $60,500 | $93,000 |
Source: Public Records
Map
Nearby Homes
- 633 Piner Rd
- 5705 Woodduck Cir
- 234 Brighton Rd
- 5610 Carolina Beach Rd Unit 13
- 301 Foxwood Ln
- 273 Foxwood Ln
- 5109 Old Myrtle Grove Rd
- 5014 Helms Port Ave
- 5500 N Warrendale Ct
- 1202 Beresford Ct
- 5353 Leisure Cir
- 5004 Laurenbridge Ln
- 5427 Ellen Dale Place Unit (Lot 45)
- 5028 Laurenbridge Ln
- 4922 Woods Edge Rd
- 804 Tisbury Ln
- 5613 Swiss Stone Ct
- 5418 Saltwater Run
- 5415 Ellen Dale Place Unit (Lot 42)
- 5531 Fayes Meadow Ct Unit (Lot 8)
- 5760 Highgrove Place
- 5761 Highgrove Place
- 5768 Highgrove Place
- 735 Piner Rd
- 5757 Highgrove Place
- 5765 Highgrove Place
- 5756 Highgrove Place
- 5753 Highgrove Place
- 801 Piner Rd
- 721 Piner Rd
- 805 Piner Rd
- 5752 Highgrove Place
- 5749 Highgrove Place
- 722 Piner Rd
- 5748 Highgrove Place
- 817 Piner Rd
- 712 Duck Downe Ct
- 5745 Highgrove Place
- 714 Piner Rd
- 708 Duck Downe Ct