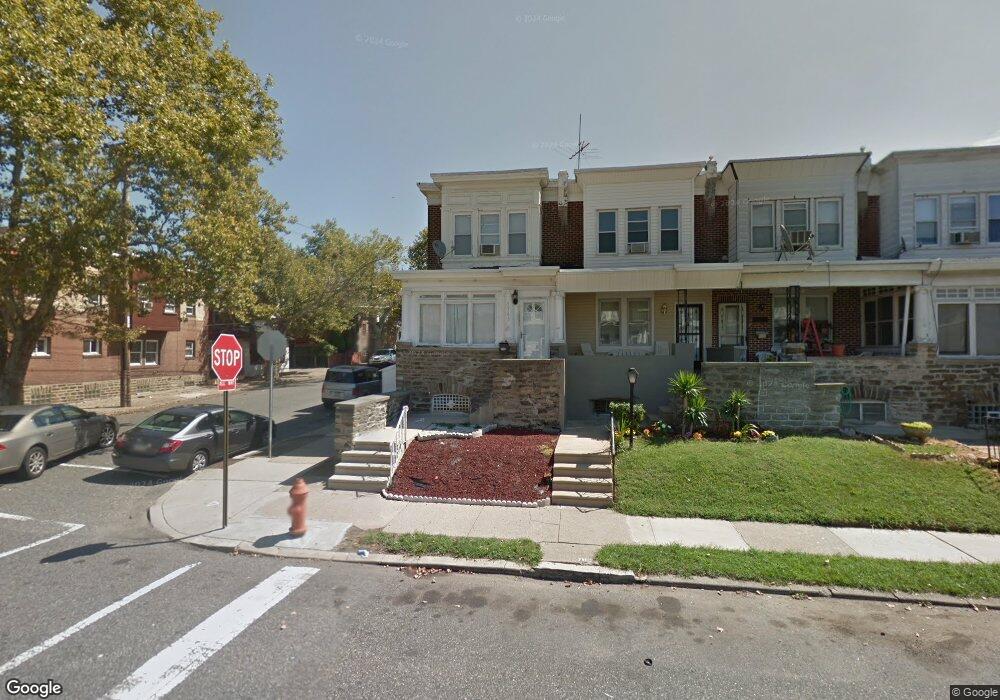
5765 N 7th St Philadelphia, PA 19120
Olney NeighborhoodEstimated Value: $139,000 - $179,000
3
Beds
1
Bath
1,246
Sq Ft
$127/Sq Ft
Est. Value
About This Home
This home is located at 5765 N 7th St, Philadelphia, PA 19120 and is currently estimated at $158,678, approximately $127 per square foot. 5765 N 7th St is a home located in Philadelphia County with nearby schools including James R. Lowell Elementary School, Grover Washington Middle School, and Samuel Fels High School.
Ownership History
Date
Name
Owned For
Owner Type
Purchase Details
Closed on
May 9, 2006
Sold by
Hud
Bought by
Yelverton Shante A
Current Estimated Value
Home Financials for this Owner
Home Financials are based on the most recent Mortgage that was taken out on this home.
Original Mortgage
$99,600
Outstanding Balance
$57,684
Interest Rate
6.4%
Mortgage Type
FHA
Estimated Equity
$100,994
Purchase Details
Closed on
Jun 6, 2005
Sold by
Adderley Ria
Bought by
Washington Mutual Bank Fa
Purchase Details
Closed on
May 10, 2005
Sold by
Washington Mutual Bank Fa
Bought by
Hud
Purchase Details
Closed on
Oct 10, 2002
Sold by
Pomerantz Gerald J and Pomerantz Susan M
Bought by
Adderley Ria
Home Financials for this Owner
Home Financials are based on the most recent Mortgage that was taken out on this home.
Original Mortgage
$61,514
Interest Rate
6.09%
Mortgage Type
FHA
Create a Home Valuation Report for This Property
The Home Valuation Report is an in-depth analysis detailing your home's value as well as a comparison with similar homes in the area
Home Values in the Area
Average Home Value in this Area
Purchase History
| Date | Buyer | Sale Price | Title Company |
|---|---|---|---|
| Yelverton Shante A | $72,000 | None Available | |
| Washington Mutual Bank Fa | $50,000 | -- | |
| Hud | -- | None Available | |
| Adderley Ria | $62,000 | -- |
Source: Public Records
Mortgage History
| Date | Status | Borrower | Loan Amount |
|---|---|---|---|
| Open | Yelverton Shante A | $99,600 | |
| Previous Owner | Adderley Ria | $61,514 |
Source: Public Records
Tax History Compared to Growth
Tax History
| Year | Tax Paid | Tax Assessment Tax Assessment Total Assessment is a certain percentage of the fair market value that is determined by local assessors to be the total taxable value of land and additions on the property. | Land | Improvement |
|---|---|---|---|---|
| 2025 | $1,900 | $164,300 | $32,860 | $131,440 |
| 2024 | $1,900 | $164,300 | $32,860 | $131,440 |
| 2023 | $1,900 | $135,700 | $27,140 | $108,560 |
| 2022 | $806 | $90,700 | $27,140 | $63,560 |
| 2021 | $1,436 | $0 | $0 | $0 |
| 2020 | $1,436 | $0 | $0 | $0 |
| 2019 | $1,335 | $0 | $0 | $0 |
| 2018 | $1,316 | $0 | $0 | $0 |
| 2017 | $1,316 | $0 | $0 | $0 |
| 2016 | $896 | $0 | $0 | $0 |
| 2015 | $858 | $0 | $0 | $0 |
| 2014 | -- | $94,000 | $9,621 | $84,379 |
| 2012 | -- | $10,656 | $2,031 | $8,625 |
Source: Public Records
Map
Nearby Homes
- 5730 N 7th St
- 5737 N Marshall St
- 5824 N Marshall St
- 5720 N Marshall St
- 5904 N 7th St
- 5940 N Franklin St
- 514 Widener St
- 5612 N 5th St
- 5516 N Marshall St
- 5648 N Lawrence St
- 5642 N 10th St
- 5507 N Marshall St
- 5500 N Marshall St
- 5921 N Lawrence St
- 5601 N 10th St
- 5606 N 10th St
- 5500 N 6th St
- 5615 N Warnock St
- 5515 N Fairhill St
- 5825 N 4th St
- 5763 N 7th St
- 5761 N 7th St
- 5759 N 7th St
- 5757 N 7th St
- 5801 N 7th St
- 5755 N 7th St
- 5803 N 7th St
- 5753 N 7th St
- 5762 N Marshall St
- 5805 N 7th St
- 5760 N Marshall St
- 5758 N Marshall St
- 5751 N 7th St
- 5756 N Marshall St
- 5807 N 7th St
- 5754 N Marshall St
- 5749 N 7th St
- 5800 N Marshall St
- 5752 N Marshall St
- 5809 N 7th St