
Seller's Agent in 2019
Rob Jenkins
RE/MAX
(770) 826-2426
35 Total Sales
Estimated Value: $358,155 - $448,000
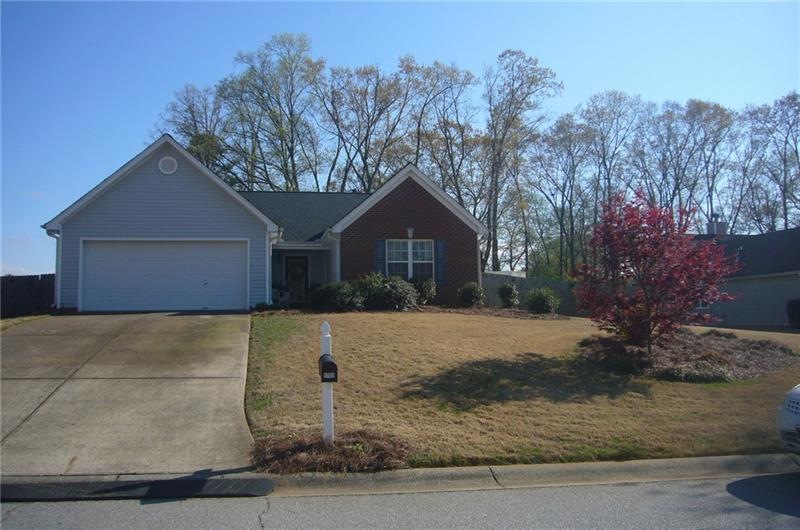
This is a charming 3BR/2BA ranch home in the Belmont Place subdivision. Open family room with fireplace and built-in bookcases. Spacious kitchen with SS appliances and breakfast area. Master with vaulted ceiling and separate shower/tub. The backyard is a MUST see! Fenced-in, a large workshop/storage, hot tub, fire pit, and PLENTY of space for the kids to play, or to entertain guests! Shopping and restaurants near by! A mile from the public access to Lake Lanier.
Last Agent to Sell the Property
Virtual Properties Realty.com License #205578 Listed on: 04/05/2019
| Date | Buyer | Sale Price | Title Company |
|---|---|---|---|
| Shalls Christopher T | -- | -- | |
| Shalls Tom | $215,000 | -- | |
| Phagan Cary | $138,000 | -- | |
| Powell Hilda L | $125,000 | -- | |
| Newberry Point Partners Llp | $378,800 | -- |
| Date | Status | Borrower | Loan Amount |
|---|---|---|---|
| Previous Owner | Powell Hilda L | $118,750 |
| Date | Event | Price | List to Sale | Price per Sq Ft | Prior Sale |
|---|---|---|---|---|---|
| 06/07/2019 06/07/19 | Rented | $1,550 | 0.0% | -- | |
| 06/04/2019 06/04/19 | Under Contract | -- | -- | -- | |
| 05/24/2019 05/24/19 | For Rent | $1,550 | 0.0% | -- | |
| 05/10/2019 05/10/19 | Sold | $215,000 | -3.2% | $132 / Sq Ft | |
| 04/13/2019 04/13/19 | Pending | -- | -- | -- | |
| 04/12/2019 04/12/19 | For Sale | $222,000 | 0.0% | $137 / Sq Ft | |
| 04/07/2019 04/07/19 | Pending | -- | -- | -- | |
| 04/05/2019 04/05/19 | For Sale | $222,000 | +60.9% | $137 / Sq Ft | |
| 03/08/2013 03/08/13 | Sold | $138,000 | 0.0% | $85 / Sq Ft | View Prior Sale |
| 02/21/2013 02/21/13 | Pending | -- | -- | -- | |
| 07/31/2012 07/31/12 | For Sale | $138,000 | -- | $85 / Sq Ft |
| Year | Tax Paid | Tax Assessment Tax Assessment Total Assessment is a certain percentage of the fair market value that is determined by local assessors to be the total taxable value of land and additions on the property. | Land | Improvement |
|---|---|---|---|---|
| 2024 | $2,945 | $137,240 | $18,040 | $119,200 |
| 2023 | $2,348 | $128,880 | $18,040 | $110,840 |
| 2022 | $2,229 | $104,240 | $18,040 | $86,200 |
| 2021 | $2,688 | $99,680 | $18,040 | $81,640 |
| 2020 | $2,396 | $92,200 | $9,840 | $82,360 |
| 2019 | $2,118 | $77,000 | $9,840 | $67,160 |
| 2018 | $2,097 | $73,840 | $11,040 | $62,800 |
| 2017 | $1,884 | $66,960 | $11,040 | $55,920 |
| 2016 | $1,691 | $60,480 | $9,040 | $51,440 |
| 2015 | $1,532 | $62,915 | $9,040 | $53,875 |
| 2014 | $1,532 | $62,915 | $9,040 | $53,875 |
Seller's Agent in 2019
Rob Jenkins
RE/MAX
(770) 826-2426
35 Total Sales
Seller's Agent in 2019
Gail Patterson
Virtual Properties Realty.com
(770) 540-5635
40 Total Sales
D
Buyer's Agent in 2019
Deborah Canova
Virtual Properties Realty.BIZ
(770) 231-3723
4 Total Sales
Source: First Multiple Listing Service (FMLS)
MLS Number: 6531637
APN: 08-0110A-00-042
Disclaimer: Certain information contained herein is derived from information provided by parties other than Homes.com. All information provided is deemed reliable, but is not guaranteed to be accurate and should be independently verified.
![]() Listings identified with the FMLS IDX logo come from FMLS and are held by brokerage firms other than the owner of this website. The listing brokerage is identified in any listing details. Information is deemed reliable but is not guaranteed. If you believe any FMLS listing contains material that infringes your copyrighted work please visit www.fmls.com/dmca to review our DMCA policy and learn how to submit a takedown request. © 2025 First Multiple Listing Service, Inc.
Listings identified with the FMLS IDX logo come from FMLS and are held by brokerage firms other than the owner of this website. The listing brokerage is identified in any listing details. Information is deemed reliable but is not guaranteed. If you believe any FMLS listing contains material that infringes your copyrighted work please visit www.fmls.com/dmca to review our DMCA policy and learn how to submit a takedown request. © 2025 First Multiple Listing Service, Inc.